Are you a member of the Splunk Community?
- Find Answers
- :
- Using Splunk
- :
- Splunk Search
- :
- Is there a guide or map to understand Splunk's int...
- Subscribe to RSS Feed
- Mark Topic as New
- Mark Topic as Read
- Float this Topic for Current User
- Bookmark Topic
- Subscribe to Topic
- Mute Topic
- Printer Friendly Page
- Mark as New
- Bookmark Message
- Subscribe to Message
- Mute Message
- Subscribe to RSS Feed
- Permalink
- Report Inappropriate Content
Does there exist some sort of map or guide to understanding Splunk's internal indexes (_internal, _audit, _introspection)? Something like:
_internal

   sourcetypes

      splunkd

         fields

            per_user_thruput (description of value data)
I have found and been given a few great examples as well as hacked up some splunk on splunk dashboards, but I would like to know what logs contain what so that we can build some additional auditing reports.
- Mark as New
- Bookmark Message
- Subscribe to Message
- Mute Message
- Subscribe to RSS Feed
- Permalink
- Report Inappropriate Content
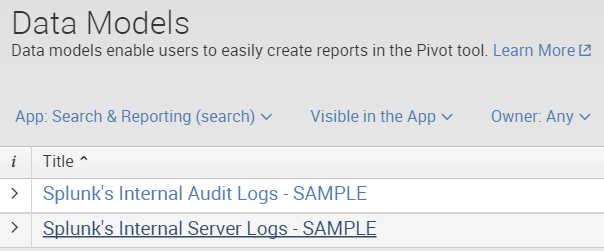
Actually, with version 6.0 some of what you want exists as sample data models included in the Search app. Go to Settings / Data Models, and choose the Search app and you'll see this:
- Mark as New
- Bookmark Message
- Subscribe to Message
- Mute Message
- Subscribe to RSS Feed
- Permalink
- Report Inappropriate Content
- Mark as New
- Bookmark Message
- Subscribe to Message
- Mute Message
- Subscribe to RSS Feed
- Permalink
- Report Inappropriate Content
A thing of beauty!
- Mark as New
- Bookmark Message
- Subscribe to Message
- Mute Message
- Subscribe to RSS Feed
- Permalink
- Report Inappropriate Content
There is a topic in the Troubleshooting Manual that provides a summary of what Splunk Enterprise logs about itself, with links to more detailed information when it is available. Is that the material you are looking for?
- Mark as New
- Bookmark Message
- Subscribe to Message
- Mute Message
- Subscribe to RSS Feed
- Permalink
- Report Inappropriate Content
Got it. There is some additional information in the topics that follow the one I previously linked, including some field information, but there isn't any comprehensive reference to the log files and fields in the documentation.
- Mark as New
- Bookmark Message
- Subscribe to Message
- Mute Message
- Subscribe to RSS Feed
- Permalink
- Report Inappropriate Content
Close, but no cigar. It does tell me what logs it covers, but very little about what those logs contain or what their fields represent.

