- Find Answers
- :
- Using Splunk
- :
- Splunk Search
- :
- How to use accum with timechart?
- Subscribe to RSS Feed
- Mark Topic as New
- Mark Topic as Read
- Float this Topic for Current User
- Bookmark Topic
- Subscribe to Topic
- Mute Topic
- Printer Friendly Page
- Mark as New
- Bookmark Message
- Subscribe to Message
- Mute Message
- Subscribe to RSS Feed
- Permalink
- Report Inappropriate Content
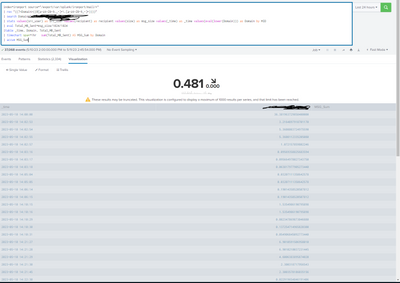
Hey, I had a quick question about my splunk search that doesnt work. Im using timechart and was wanting to display the single value visualization while having that sparkline. On some of these forum posts, i saw where they were using accum right after timechart, but my visualization just displays one of the values, im wanting it to accumulate while showing the sparkline.
heres the code im using:
index=ironport source="/export/var/splunk/ironport/mail/*"
| rex "((?<Domain>((@[a-zA-Z0-9._-]+\.[a-zA-Z0-9_-]+))))"
| search Domain="@mail321.bluematrix.com"
| stats values(src_user) as src_user values(recipient) as recipient values(size) as msg_size values(_time) as _time values(eval(lower(Domain))) as Domain by MID
| eval Total_MB_Sent=msg_size/1024/1024
|table _time, Domain, Total_MB_Sent
| timechart span=1hr   sum(Total_MB_Sent) AS MSG_Sum by Domain
| accum MSG_Sum
I think its just updating the value shown, but it isnt accumulating. Any help would be appreciated.
- Mark as New
- Bookmark Message
- Subscribe to Message
- Mute Message
- Subscribe to RSS Feed
- Permalink
- Report Inappropriate Content
Hi @Abass42
As soon as you use a group by clause in timechart the field headers become the group by result - in your case a domain name. The accum would need to the domain field name as MSG_Sum does not exist due to the by clause grouping.
As the single value viz only shows the last value of the first column (other than _time) anyway, then there is no point having a domain group by. So, this is what you would use...
index=ironport source="/export/var/splunk/ironport/mail/*"
| rex "((?<Domain>((@[a-zA-Z0-9._-]+\.[a-zA-Z0-9_-]+))))"
| search Domain="@mail321.bluematrix.com"
| stats values(src_user) as src_user values(recipient) as recipient values(size) as msg_size values(_time) as _time values(eval(lower(Domain))) as Domain by MID
| eval Total_MB_Sent=msg_size/1024/1024
|table _time, Domain, Total_MB_Sent
| timechart span=1hr   sum(Total_MB_Sent) AS MSG_Sum
| accum MSG_Sum
If you have different domains to display, then individually filter them before the timechart command, like this...
... your search ...
| table _time, Domain, Total_MB_Sent
| search Domain=<your domain>
| timechart span=1hr sum(Total_MB_Sent) AS MSG_Sum
| accum MSG_Sum
Or if you no the domain name then you can use accum <domain>, instead when using the group by clause.
Hope that makes sense and helps
- Mark as New
- Bookmark Message
- Subscribe to Message
- Mute Message
- Subscribe to RSS Feed
- Permalink
- Report Inappropriate Content
Wow. I tried multiple variations of that query, and one of them at some point i thought was what you suggested, but apparently not. Your query worked like a charm. Thank you. I appreciate your help. 🤝

