Are you a member of the Splunk Community?
- Find Answers
- :
- Using Splunk
- :
- Splunk Search
- :
- Re: How to search the most recent value for 2 fiel...
- Subscribe to RSS Feed
- Mark Topic as New
- Mark Topic as Read
- Float this Topic for Current User
- Bookmark Topic
- Subscribe to Topic
- Mute Topic
- Printer Friendly Page
- Mark as New
- Bookmark Message
- Subscribe to Message
- Mute Message
- Subscribe to RSS Feed
- Permalink
- Report Inappropriate Content
I am trying to figure out how to retrieve the most recent value for the free memory and used memory in MB. I want to plot them in a pie chart to get an accurate picture of memory usage, instead of a timechart that gives usage over a period of time. How should I get recent value of the fields?
Search:
index=os sourcetype=vmstat host=$host$ | timechart median(memFreeMB) as Mem_Free, median(memUsedMB) as Mem_Used by host
- Mark as New
- Bookmark Message
- Subscribe to Message
- Mute Message
- Subscribe to RSS Feed
- Permalink
- Report Inappropriate Content
If you want the latest value only, you need to use a stats command using the first function. It is important to understand that Splunk organizes the data in a reverse-time notation. Assume for example that you have a data set like this:
Wed Apr 15 10:10:01 EDT 2015 myserver memFreeMB=0 memUsedMB=4096
Wed Apr 15 10:20:02 EDT 2015 myserver memFreeMB=1024 memUsedMB=3072
Wed Apr 15 10:30:01 EDT 2015 myserver memFreeMB=2048 memUsedMB=2048
Wed Apr 15 10:40:01 EDT 2015 myserver memFreeMB=3072 memUsedMB=1024
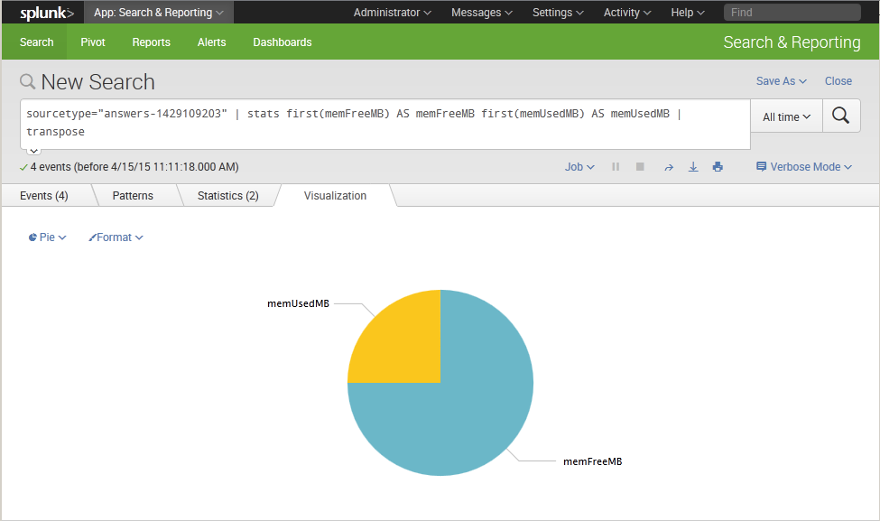
Once you index the data, you end up with a reverse-time ordering where the latest event is shown first. Add the following using the stats command and you get a table.
| stats first(memFreeMB) AS memFreeMB first(memUsedMB) AS memUsedMB
Once you've done that, you need to flip the table so that you have a col, val format. That's the expected format for a pie chart. The easiest way is to use the transpose command.
| transpose
All together you get something like this:
I hope this helps you.
--
gc
- Mark as New
- Bookmark Message
- Subscribe to Message
- Mute Message
- Subscribe to RSS Feed
- Permalink
- Report Inappropriate Content
@Giberto Castillo
Thank you so much for the explanation of the solution as well... It worked perfectly fine...
- Mark as New
- Bookmark Message
- Subscribe to Message
- Mute Message
- Subscribe to RSS Feed
- Permalink
- Report Inappropriate Content
Hi sushmitha_mj ,
to get recent value of a field you can use first() with stats cammand :
for exemple:
index=os sourcetype=vmstat host=$host$ |stats first(memFreeMB) as Mem_Free, first(memUsedMB) as Mem_Used by host
- Mark as New
- Bookmark Message
- Subscribe to Message
- Mute Message
- Subscribe to RSS Feed
- Permalink
- Report Inappropriate Content
@stephane_cyrille
It worked thanks...

