- Mark as New
- Bookmark Message
- Subscribe to Message
- Mute Message
- Subscribe to RSS Feed
- Permalink
- Report Inappropriate Content
I'm trying to do a basic plot of network traffic (bps) by minute over three days. I uploaded a .csv file that has the following values (table below): Date/Time, Inbound Traffic (bps), and Outbound Traffic (bps).
I assume timechart would be the way to go, but is there an alternative to using count with timechart? Would xyseries be better for this?
Thx
Date/Time Inbound Traffic (bps) Outbound Traffic (bps)
2/6/2015 9:05 5041.333333 16797.2
2/6/2015 9:06 81465.06667 46898.13333
2/6/2015 9:07 75185.86667 39628.4
2/6/2015 9:08 63014.26667 36598.53333
2/6/2015 9:09 59666.53333 33969.2
2/6/2015 9:10 59962.66667 34255.86667
2/6/2015 9:11 58208.8 33594.13333
2/6/2015 9:12 58009.73333 32810
2/6/2015 9:13 57551.6 31079.86667
2/6/2015 9:14 58302.8 32979.33333
2/6/2015 9:15 55626.8 32290.26667
2/6/2015 9:16 57272.93333 30226.66667
2/6/2015 9:17 52814.26667 28473.46667
2/6/2015 9:18 50604.66667 24304.13333
- Mark as New
- Bookmark Message
- Subscribe to Message
- Mute Message
- Subscribe to RSS Feed
- Permalink
- Report Inappropriate Content
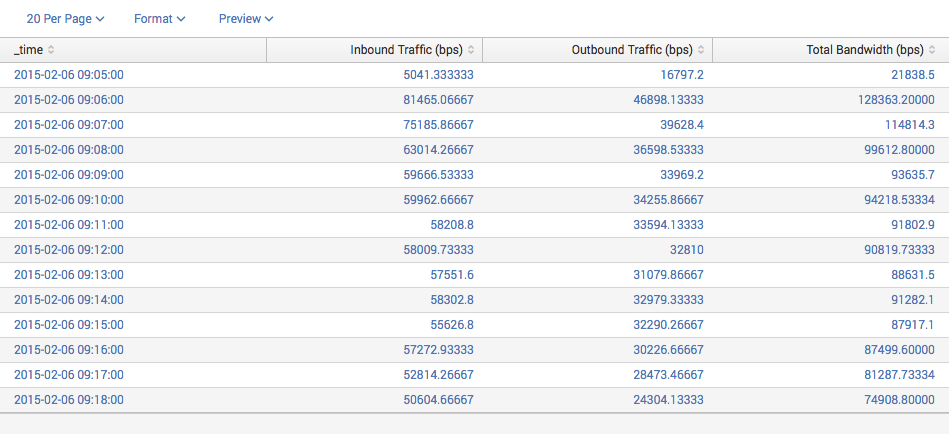
I put your file into an index to test this and used:
source="215776.csv" index="answers" | eval Bandwidth=Inbound+Outbound | timechart span=1m values(Inbound) as "Inbound Traffic (bps)",values(Outbound) as "Outbound Traffic (bps)",values(Bandwidth) as "Total Bandwidth (bps)"
Which resulted in:

Is this what you need?
Jesse Trucks
Minister of Magic
- Mark as New
- Bookmark Message
- Subscribe to Message
- Mute Message
- Subscribe to RSS Feed
- Permalink
- Report Inappropriate Content
I put your file into an index to test this and used:
source="215776.csv" index="answers" | eval Bandwidth=Inbound+Outbound | timechart span=1m values(Inbound) as "Inbound Traffic (bps)",values(Outbound) as "Outbound Traffic (bps)",values(Bandwidth) as "Total Bandwidth (bps)"
Which resulted in:
Is this what you need?
Jesse Trucks
Minister of Magic
- Mark as New
- Bookmark Message
- Subscribe to Message
- Mute Message
- Subscribe to RSS Feed
- Permalink
- Report Inappropriate Content
Got it! I used double quotes in the eval above not single quotes. I apologize for that error. Double quotes make for a literal string interpretation, whereas single quotes interprets the contents as a field name.
Therfore, try this:
source="sw_report_flow_02_09_15.csv" index="answers" | eval Bandwidth='Inbound Traffic _bps'+'Outbound Traffic _bps' | timechart span=1m values("Inbound Traffic _bps") as Inbound,values("Outbound Traffic _bps") as Outbound,values(Bandwidth) as Bandwidth
I get this:
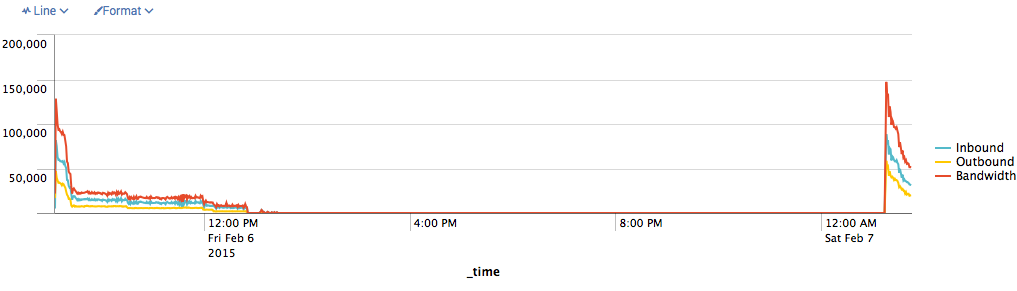
I, also, set the chart to display NULL values as zero, hence the flat line at the bottom that shoots up on the right when there is data again.
( If your settings truncate results, see http://answers.splunk.com/answers/73745/max-data-points-that-charts-can-handle.html )
Jesse Trucks
Minister of Magic
- Mark as New
- Bookmark Message
- Subscribe to Message
- Mute Message
- Subscribe to RSS Feed
- Permalink
- Report Inappropriate Content
Jesse, awesome - thx a million for your help and patience! Greatly appreciated!
- Mark as New
- Bookmark Message
- Subscribe to Message
- Mute Message
- Subscribe to RSS Feed
- Permalink
- Report Inappropriate Content
- Mark as New
- Bookmark Message
- Subscribe to Message
- Mute Message
- Subscribe to RSS Feed
- Permalink
- Report Inappropriate Content
Can you put the file somewhere and provide a URL? I think the image link only works with images.
Jesse Trucks
Minister of Magic
- Mark as New
- Bookmark Message
- Subscribe to Message
- Mute Message
- Subscribe to RSS Feed
- Permalink
- Report Inappropriate Content
I'm actually using the Attachment link, and when I click on 'edit' for the one posting that lists the two files, I actually see the file attached, which is confusing as to why it's not actually being posted.
- Mark as New
- Bookmark Message
- Subscribe to Message
- Mute Message
- Subscribe to RSS Feed
- Permalink
- Report Inappropriate Content
I think I figured it out. I attach the file and then after it's uploaded, I dragged the file into the body of the text and was able to click on it and download the file. Hope this works for you. Thx for sticking through this!
- Mark as New
- Bookmark Message
- Subscribe to Message
- Mute Message
- Subscribe to RSS Feed
- Permalink
- Report Inappropriate Content
File attached - please try this
- Mark as New
- Bookmark Message
- Subscribe to Message
- Mute Message
- Subscribe to RSS Feed
- Permalink
- Report Inappropriate Content
No file attached. It looks like maybe an error in the filename?
Jesse Trucks
Minister of Magic
- Mark as New
- Bookmark Message
- Subscribe to Message
- Mute Message
- Subscribe to RSS Feed
- Permalink
- Report Inappropriate Content
My bad - wasn't seeing the upload option when replying to a message. Needed to add an answer to see the option. Screenshot below:

- Mark as New
- Bookmark Message
- Subscribe to Message
- Mute Message
- Subscribe to RSS Feed
- Permalink
- Report Inappropriate Content
I only had the subset of data you posted in the question, so the charts might not look the same.
My table results driving the chart are:
Jesse Trucks
Minister of Magic
- Mark as New
- Bookmark Message
- Subscribe to Message
- Mute Message
- Subscribe to RSS Feed
- Permalink
- Report Inappropriate Content
Thx for the great info. That is exactly what I wanted, however, I had to modify my search as such:
| eval Bandwidth=Inbound+Outbound | timechart span=1m values("Inbound Traffic _bps") as "Inbound" ,values("Outbound Traffic _bps") as "Outbound"
With that, I'm seeing a different result than you got. How can I post a screenshot?
Thx
- Mark as New
- Bookmark Message
- Subscribe to Message
- Mute Message
- Subscribe to RSS Feed
- Permalink
- Report Inappropriate Content
You can save the screenshot, then click the little square Polaroid looking icon on the edit bar above the text entry box.
I suspect since you have different field names, you need to change the eval statement to:
... | eval Bandwidth="Inbound Traffic _bps" + "Outbound Traffic _bps" | ...
Jesse Trucks
Minister of Magic
- Mark as New
- Bookmark Message
- Subscribe to Message
- Mute Message
- Subscribe to RSS Feed
- Permalink
- Report Inappropriate Content
Missed that first eval statement - thx
New search query:
| eval Bandwidth="Inbound Traffic _bps" + "Outbound Traffic _bps"| timechart span=1m values("Inbound Traffic _bps") as "Inbound" ,values("Outbound Traffic _bps") as "Outbound" values(Bandwidth) as "Total Bandwidth (bps)"
What do I enter for the image URL?
Thx again
- Mark as New
- Bookmark Message
- Subscribe to Message
- Mute Message
- Subscribe to RSS Feed
- Permalink
- Report Inappropriate Content
Just choose "upload" and the Answers app will use a local image you've uploaded.
Jesse Trucks
Minister of Magic
- Mark as New
- Bookmark Message
- Subscribe to Message
- Mute Message
- Subscribe to RSS Feed
- Permalink
- Report Inappropriate Content
I think timechart is the way to go. Otherwise you may run into plotting issues with the date time field.
http://docs.splunk.com/Documentation/Splunk/6.2.1/Viz/ChartDisplayissues
You're not really asking how to plot it in a specific way, but the documentation is really useful. I would play around with the different values you can use.
http://docs.splunk.com/Documentation/Splunk/6.2.1/SearchReference/Timechart#Examples
- Mark as New
- Bookmark Message
- Subscribe to Message
- Mute Message
- Subscribe to RSS Feed
- Permalink
- Report Inappropriate Content
Thx for the info
