- Find Answers
- :
- Using Splunk
- :
- Splunk Search
- :
- How to create a search that shows a trending value...
- Subscribe to RSS Feed
- Mark Topic as New
- Mark Topic as Read
- Float this Topic for Current User
- Bookmark Topic
- Subscribe to Topic
- Mute Topic
- Printer Friendly Page
- Mark as New
- Bookmark Message
- Subscribe to Message
- Mute Message
- Subscribe to RSS Feed
- Permalink
- Report Inappropriate Content
Hello,
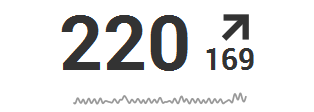
I need to make a search in a dashboard which creates a trending value comparing the range of time you pick (ex: 7 days) to the range of time before this one (the 7 days before)
Example: For a time range of 4 hours, if my search starts at 10:22,
The single value would show 6:22 to 10:22
The trend arrow value compare it to 2:22 to 6:22

Tell me if you need more details.
- Mark as New
- Bookmark Message
- Subscribe to Message
- Mute Message
- Subscribe to RSS Feed
- Permalink
- Report Inappropriate Content
Hi Iranes,
This an example I made a long time ago, but it should help you get what you want.
It takes the time select from the time range picker and uses the that for the trend, instead of the default timechart span values (Oh look, I'm mentioned there again http://docs.splunk.com/Documentation/Splunk/6.4.0/SearchReference/Timechart#Default_time_spans 😉 )
Here is the run everywhere dashboard (It uses the Dashboard example App https://splunkbase.splunk.com/app/1603/ js and css) :
<form script="single_trend.js" stylesheet="single_trend.css" hideFooter="true">
  <label>Single Value Trend</label>
  <fieldset submitButton="false" autoRun="true">
    <input type="time" token="time" searchWhenChanged="true">
      <label></label>
      <default>
        <earliest>@d</earliest>
        <latest>now</latest>
      </default>
    </input>
  </fieldset>
  <row>
    <panel>
      <title>the easy way - half the time</title>
      <single>
        <title>1/2 timerange</title>
        <search>
          <query>index=_internal  earliest=$time.earliest$  sourcetype=splunkd              | timechart [ | gentimes start=-1 | eval myNow = now() | eval myThen=relative_time(now(), "$time.earliest$") | eval span=round(( myNow - myThen ) / 1) | return span ] count              | reverse</query>
          <earliest>$time.earliest$</earliest>
          <latest>$time.latest$</latest>
        </search>
        <option name="field">count</option>
        <option name="linkView">search</option>
        <option name="drilldown">none</option>
        <option name="underLabel">difference</option>
        <option name="colorBy">value</option>
        <option name="colorMode">none</option>
        <option name="numberPrecision">0</option>
        <option name="showSparkline">1</option>
        <option name="showTrendIndicator">1</option>
        <option name="trendColorInterpretation">standard</option>
        <option name="trendDisplayMode">percent</option>
        <option name="unitPosition">after</option>
        <option name="useColors">0</option>
        <option name="useThousandSeparators">1</option>
        <option name="rangeColors">["0x65a637","0x6db7c6","0xf7bc38","0xf58f39","0xd93f3c"]</option>
        <option name="rangeValues">[0,30,70,100]</option>
      </single>
    </panel>
    <panel>
      <title>the easy way - double the time</title>
      <single>
        <title>two times the time range</title>
        <search>
          <query>index=_internal              [ | gentimes start=-1 | eval earliest=now() - ( round(tonumber(now()-relative_time(now(), "$time.earliest$")),0) *2 ) | return earliest              ] sourcetype=splunkd              | timechart [ | gentimes start=-1 | eval myNow = now() | eval myThen=round(relative_time(now(), "$time.earliest$")) | eval span=myNow-myThen | return span ] count              | reverse</query>
          <earliest>$time.earliest$</earliest>
          <latest>$time.latest$</latest>
        </search>
        <option name="field">count</option>
        <option name="linkView">search</option>
        <option name="drilldown">none</option>
        <option name="underLabel">difference</option>
        <option name="colorBy">value</option>
        <option name="colorMode">none</option>
        <option name="numberPrecision">0</option>
        <option name="showSparkline">1</option>
        <option name="showTrendIndicator">1</option>
        <option name="trendColorInterpretation">standard</option>
        <option name="trendDisplayMode">absolute</option>
        <option name="unitPosition">after</option>
        <option name="useColors">0</option>
        <option name="useThousandSeparators">1</option>
      </single>
    </panel>
  </row>
</form>
To match your use case, just change the time range in your base search to be earliest=-14d and it should work or at least give you a starting point.
Hope this helps ...
cheers, MuS
UPDATE:
I'll try to explain what happens in the second example.
index=_internal
search index=_internal
[ | gentimes start=-1
start a subsearch and this step does basically nothing
| eval earliest=now() - ( round(tonumber(now()-relative_time(now(), "$time.earliest$")),0) *2 )
evaluate a field called earliest which uses the earliest time from token time and multiply it times two to go back in time
| return earliest ]
this will return earliest=value to the base search
sourcetype=splunkd
adding sourcetype to the base search
| timechart
do a timechart on the base search results
[ | gentimes start=-1
again start a subsearch and this step does basically nothing
| eval myNow = now() | eval myThen=round(relative_time(now(), "$time.earliest$")) | eval span=myNow-myThen
evaluate a field called myNow which is now() and myThen which is now() substracted by earliest time from token time and rounded to remove anything after the ,. Finally calculate the span so we only get back two results from the timechart
| return span ]
return a field called span to be used in timechart
count
count the timechart results
| reverse
reverse the order so it makes sense in the trending single value panel
Done, success - accept the answer, upvote the answer, have a beer - Thanks 🙂
- Mark as New
- Bookmark Message
- Subscribe to Message
- Mute Message
- Subscribe to RSS Feed
- Permalink
- Report Inappropriate Content
Hi MuS,
Thank you for your help! 🙂
I think the fact that the _time value on the second row display 1970-01-01 01:00:00 is due to a bug because the count value match with my tests.
Regarding the query, you just have to remove the /2 in the span value to make it work.
Like this:
index=_internal [ | gentimes start=-1 | eval earliest=now() - ( round(tonumber(now()-relative_time(now(), "$time.earliest$")),0) *2 ) | return earliest ] sourcetype=splunkd| timechart [ | gentimes start=-1 | eval span=now() - ( round(tonumber(now()-relative_time(now(), "$time.earliest$")),0)) | return span ] count | reverse
One last thing, if you want to use this with datamodels , use tags.
Like this:
tag=ids tag=attack action=blocked [ | gentimes start=-1 | eval earliest=now() - ( round(tonumber(now()-relative_time(now(), "$time.earliest$")),0) *2 ) | return earliest ] | timechart [ | gentimes start=-1 | eval span=now() - ( round(tonumber(now()-relative_time(now(), "$time.earliest$")),0)) | return span ] count | reverse
Regards,
Iranes
- Mark as New
- Bookmark Message
- Subscribe to Message
- Mute Message
- Subscribe to RSS Feed
- Permalink
- Report Inappropriate Content
Thank you for responding so quickly!
I try your request, "the easy way" request exactly , and it returns me "Search is waiting for input...", and it's because of $time.earliest$
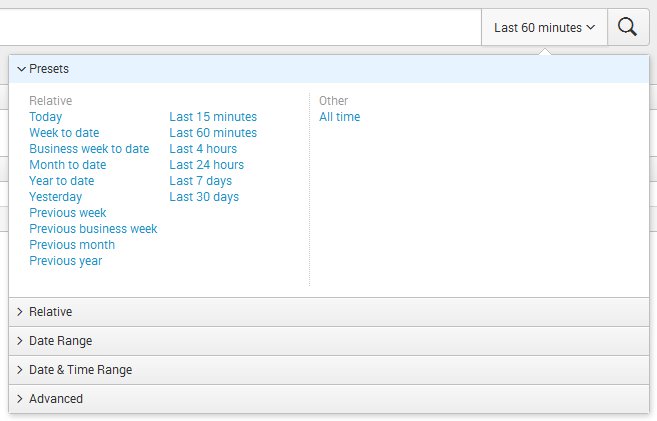
i thought the $time.earliest$ and $time.latest$ are the two variables that define the range of the time picker.
Otherwise, i would like (if my search start at 14h42 and the time picker is 60 minutes) to see in the _time column at the first row 13h42 (13h42 - 14h42), then the second row 12h42 (12h42 - 13h42).
My needs are close to this topic:
https://answers.splunk.com/answers/333319/how-to-create-a-search-to-show-a-trending-single-v.html
But as you can see, this search is static, that mean if we change the time picker the result will not match.
- Mark as New
- Bookmark Message
- Subscribe to Message
- Mute Message
- Subscribe to RSS Feed
- Permalink
- Report Inappropriate Content
Hi Iranes,
try this:
<panel>
  <title>the easy way - second version</title>
  <single>
    <title>two times the time range</title>
    <search>
      <query>index=_internal [|gentimes start=-1 | eval earliest=now() - ( round(tonumber(now()-relative_time(now(), "$time.earliest$")),0) *2 ) | return earliest ] sourcetype=splunkd | timechart [|gentimes start=-1 | eval span=round(tonumber(now()-relative_time(now(), "$time.earliest$"))/2,0) | return span ] count              | reverse</query>
      <earliest>$time.earliest$</earliest>
      <latest>$time.latest$</latest>
    </search>
    <option name="field">count</option>
    <option name="linkView">search</option>
    <option name="drilldown">none</option>
    <option name="underLabel">difference</option>
    <option name="colorBy">value</option>
    <option name="colorMode">none</option>
    <option name="numberPrecision">0</option>
    <option name="showSparkline">1</option>
    <option name="showTrendIndicator">1</option>
    <option name="trendColorInterpretation">standard</option>
    <option name="trendDisplayMode">absolute</option>
    <option name="unitPosition">after</option>
    <option name="useColors">0</option>
    <option name="useThousandSeparators">1</option>
  </single>
</panel>
Remember to set the token for time range picker to be time otherwise you will get Search is waiting for input
cheers, MuS
- Mark as New
- Bookmark Message
- Subscribe to Message
- Mute Message
- Subscribe to RSS Feed
- Permalink
- Report Inappropriate Content
Hi MuS!
I try your query but modified it a little because the result showed more than 2 row and the _time value of the first row doesn't match with the time picker value.
(ex: i run the search at 16h32 and the time picker is 60min ago. Your query display 16h10 while the modified version show 15h32 (which describe an interval of 1hour (15h32 to 16h32))
Here is the modified version:
index=_internal [|gentimes start=-1 | eval earliest=now() - ( round(tonumber(now()-relative_time(now(), "$time.earliest$")),0) *2 ) | return earliest ] sourcetype=splunkd | timechart [|gentimes start=-1 | eval span=round(tonumber(relative_time(now(), "$time.earliest$"))/2,0) | return span ] count
Regarding to the second row, as you can see in the pic the _time value is not correct
I think because there is a problem with the span or earliest value because if i remove the "/2" it show me the 1970 January 1st (2016-1970 =46 and 46/2=23 ; so 2016-23=1993)
PS: Could you explain me each instruction of your query to be sure I understood?
Regards.
Iranes
- Mark as New
- Bookmark Message
- Subscribe to Message
- Mute Message
- Subscribe to RSS Feed
- Permalink
- Report Inappropriate Content
Hi Iranes,
Thanks for pushing me one level up in Splunk-Fu 😉 This was good spotting and I must admit the dashboard was not finished. So I updated the answer with a working example.
cheers, MuS


