- Find Answers
- :
- Using Splunk
- :
- Splunk Search
- :
- How to combine data from same field?
- Subscribe to RSS Feed
- Mark Topic as New
- Mark Topic as Read
- Float this Topic for Current User
- Bookmark Topic
- Subscribe to Topic
- Mute Topic
- Printer Friendly Page
- Mark as New
- Bookmark Message
- Subscribe to Message
- Mute Message
- Subscribe to RSS Feed
- Permalink
- Report Inappropriate Content
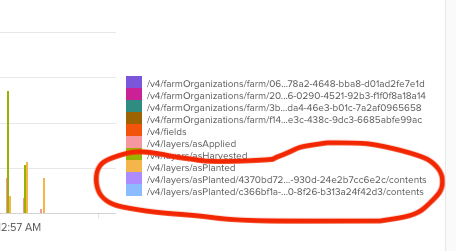
I am looking to chart a field that contains a request path but want to display and get a total count of all events that contain the root request path(a) and events that contain the root + <some guid>/contents.(b) The path is a field I manually extracted called "request_path_in_request"
Example of the path I want to combine in the cart:
(a)path=/v4/layers/asPlanted
(b)path=/v4/layers/asPlanted<some guid>/contents
Here is my Splunk query so far:
source="partners-api-ol" request_path_in_request="/v*" | timechart count by request_path_in_request useother=f limit=10
And here is how that field is getting charted:
Is there a way to show only category of "/v4/layers/asPlanted" , but have the count be the total of all the events with that root path?
- Mark as New
- Bookmark Message
- Subscribe to Message
- Mute Message
- Subscribe to RSS Feed
- Permalink
- Report Inappropriate Content
Hi @ag_yeck
If I understand what you are trying to do correctly, you just need to define a new field (using a regex command for this is good) to group your results by in the timechart statement.
source="partners-api-ol" request_path_in_request="/v*"
| rex field=request_path_in_request "(?<request_root_path>^(?:\/\w+){1,3})"
| timechart count BY request_root_path useother=f limit=10
The regex is pulling out the first / delimited segments, up to levels 3 deep, and assigning this the field name request_root_path. This can then be used to group summarise the counts in timechart.
Hope this helps
- Mark as New
- Bookmark Message
- Subscribe to Message
- Mute Message
- Subscribe to RSS Feed
- Permalink
- Report Inappropriate Content
This is a less expensive and more semantic method using split and mvindex.
source="partners-api-ol" request_path_in_request="/v*" | timechart count by request_path_in_request useother=f limit=10
| eval request_path_in_request = split(request_path_in_request, "/")
| eval rootpath = mvjoin(mvindex(request_path_in_request, 0,3), "/")
- Mark as New
- Bookmark Message
- Subscribe to Message
- Mute Message
- Subscribe to RSS Feed
- Permalink
- Report Inappropriate Content
@yuanliu I like the idea of just using semantics to solve, but this did not change the visualization. Maybe I need to use "rootpath" on the "timechart" line?
- Mark as New
- Bookmark Message
- Subscribe to Message
- Mute Message
- Subscribe to RSS Feed
- Permalink
- Report Inappropriate Content
Yes, that's the idea. If you want to use request_path_in_request as you orginally do, you can do
| eval request_path_in_request = mvjoin(mvindex(request_path_in_request, 0,3), "/")But doing so would be less semantic. Personally, I often assign modified values back to original field name. But that's only when the modification do not considerably alter the semantic meaning of the original field name. (I did use | eval request_path_in_request = split(request_path_in_request, "/") in my illustration.)
- Mark as New
- Bookmark Message
- Subscribe to Message
- Mute Message
- Subscribe to RSS Feed
- Permalink
- Report Inappropriate Content
Hi @ag_yeck
If I understand what you are trying to do correctly, you just need to define a new field (using a regex command for this is good) to group your results by in the timechart statement.
source="partners-api-ol" request_path_in_request="/v*"
| rex field=request_path_in_request "(?<request_root_path>^(?:\/\w+){1,3})"
| timechart count BY request_root_path useother=f limit=10
The regex is pulling out the first / delimited segments, up to levels 3 deep, and assigning this the field name request_root_path. This can then be used to group summarise the counts in timechart.
Hope this helps
- Mark as New
- Bookmark Message
- Subscribe to Message
- Mute Message
- Subscribe to RSS Feed
- Permalink
- Report Inappropriate Content
Thank you @yeahnah , that worked! I am a Splunk noob so having the explanation after the solution is very helpful.

