- Find Answers
- :
- Using Splunk
- :
- Splunk Search
- :
- How to chart a delta instead cumulative values?
- Subscribe to RSS Feed
- Mark Topic as New
- Mark Topic as Read
- Float this Topic for Current User
- Bookmark Topic
- Subscribe to Topic
- Mute Topic
- Printer Friendly Page
- Mark as New
- Bookmark Message
- Subscribe to Message
- Mute Message
- Subscribe to RSS Feed
- Permalink
- Report Inappropriate Content
My current project polls a device every 15 minutes to pull a counter which is then charted. Thanks to members here, I now have this working as desired. Here is an example search:
index=index
| where key="key_01"
| timechart span=15m values(value) by mac_address
The key "key_01" is a counter that increases over time. If there is no more activity, the key stays at its current value. So over time, we are counting totals.
This produces a lovely line chart or bar chart.
I would now like to be able to instead display the delta between the values, so instead of showing the accumulated total, we only see "new" counters since the last value - ie the delta.
I've been reading posts and playing with the delta command but so far not been able to get it to work.
Here is what I thought I would need:
index=index
| where key="key_01"
| delta key_01 as delta_01
| timechart span=15m values(value) by mac_address
I would like to ask if anyone can help with getting the syntax right. As always, any help very much appreciated!
NM
- Mark as New
- Bookmark Message
- Subscribe to Message
- Mute Message
- Subscribe to RSS Feed
- Permalink
- Report Inappropriate Content
@neilmac64 Sorry, I used a different field name. I corrected the search in my previous post. Please try it again.
- Mark as New
- Bookmark Message
- Subscribe to Message
- Mute Message
- Subscribe to RSS Feed
- Permalink
- Report Inappropriate Content
Hi Paul,
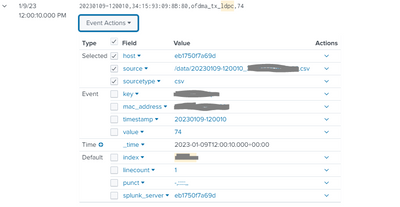
Here is an example of one of the values we track.
Here is the data at source. It is pulled from a csv file. I have masked the actual key value as key_01
20230109-120010,34:15:93:09:8B:80,key_01,74
This input will repeat every 15 minutes, with a new value that will always be either the same or will increment up.
Here is what I see in search (identifying values greyed out):
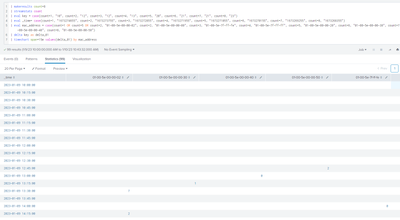
I pasted your string into search. Here's what it showed:
Thanks again for the help.
NM
- Mark as New
- Bookmark Message
- Subscribe to Message
- Mute Message
- Subscribe to RSS Feed
- Permalink
- Report Inappropriate Content
@neilmac64 Okay, thanks for the sample event!
The field "value" contains the numerical value. So you have to use this field in the delta command to calculate the difference between the current and previous event.
index=indexA key="key_01"
| delta value as delta_value
| timechart span=15m values(delta_value) by mac_address
- Mark as New
- Bookmark Message
- Subscribe to Message
- Mute Message
- Subscribe to RSS Feed
- Permalink
- Report Inappropriate Content
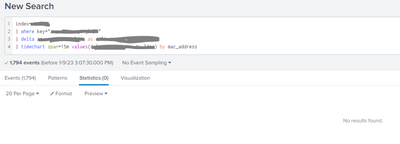
I still can't get anything with that -
Here is my current string with the changes you suggest:
index=index
| where key="key_01"
| delta value as delta_key_01
| timechart span=15m values(value) by mac_address
The chart is the same with or without the delta line.
NM
- Mark as New
- Bookmark Message
- Subscribe to Message
- Mute Message
- Subscribe to RSS Feed
- Permalink
- Report Inappropriate Content
@neilmac64 You modified my search wrongly.
In Line 2 we use the delta command and save the reulsts in a new field that is named as "delta_value".
In Line 3 we use the transforming command timechart and group the values from field "delta_value" by mac_address. In your search you use the values from field "value" that contains the totals and not the difference. That is the reason why your chart is the same as before.
Please use my search and just adjust the index.
index=indexA key="key_01"
| delta value as delta_value
| timechart span=15m values(delta_value) by mac_address
- Mark as New
- Bookmark Message
- Subscribe to Message
- Mute Message
- Subscribe to RSS Feed
- Permalink
- Report Inappropriate Content
Aha! Progress !
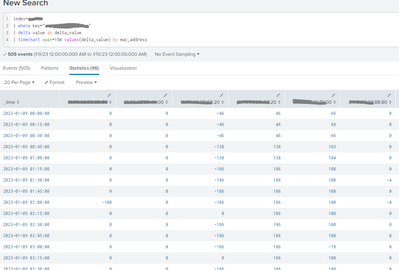
Yes, I missed that change. OK here is the latest chart:
I am seeing negative values - this should not be the case as the counter increments. It also seems to be showing the deltas between mac addresses rather than the delta over the previous counter. (check the numbers in the table)
- Mark as New
- Bookmark Message
- Subscribe to Message
- Mute Message
- Subscribe to RSS Feed
- Permalink
- Report Inappropriate Content
Okay, the delta command does not support grouping and just calculate the delta between the current and the previous event in search order. That's why you must use streamstats command.
index=indexA key="key_01"
| streamstats current=f last(value) as stream_keys by mac_address
| eval diff = stream_keys - value
| timechart span=15m values(diff) by mac_address
- Mark as New
- Bookmark Message
- Subscribe to Message
- Mute Message
- Subscribe to RSS Feed
- Permalink
- Report Inappropriate Content
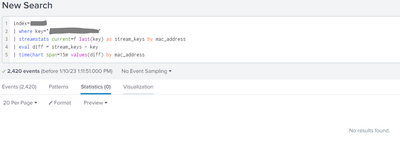
Here is the current search string as amended:
index=index
| where key="key_01"
| streamstats current=f last(key) as stream_keys by mac_address
| eval diff = stream_keys - key
| timechart span=15m values(diff) by mac_address
This does not produce any results
- Mark as New
- Bookmark Message
- Subscribe to Message
- Mute Message
- Subscribe to RSS Feed
- Permalink
- Report Inappropriate Content
@neilmac64 Sorry, I used a different field name. I corrected the search in my previous post. Please try it again.
- Mark as New
- Bookmark Message
- Subscribe to Message
- Mute Message
- Subscribe to RSS Feed
- Permalink
- Report Inappropriate Content
Aha! We're definitely getting somewhere -
This looks very close, however there are still negative values. I believe this may have been caused by us setting the counters back to zero before the test - I'm examining the data now.
If this is the case then I need to filter to show values above 0.
Can you help with how to do that?
- Mark as New
- Bookmark Message
- Subscribe to Message
- Mute Message
- Subscribe to RSS Feed
- Permalink
- Report Inappropriate Content
Perfect!
Yes, of course just add
|where diff>0after the eval command.
- Mark as New
- Bookmark Message
- Subscribe to Message
- Mute Message
- Subscribe to RSS Feed
- Permalink
- Report Inappropriate Content
Outstanding help @PaulPanther
Thanks so much for sticking with this and finding an answer. I accepted the solution for defining the delta. The icing on the cake was filtering for above zero - Karma also given.
Thanks again, it's really appreciated.
NM
- Mark as New
- Bookmark Message
- Subscribe to Message
- Mute Message
- Subscribe to RSS Feed
- Permalink
- Report Inappropriate Content
@neilmac64 Following search should do the trick:
index=indexA key="key_01"
| delta key as delta_01
| timechart span=15m values(delta_01) by mac_address
- Mark as New
- Bookmark Message
- Subscribe to Message
- Mute Message
- Subscribe to RSS Feed
- Permalink
- Report Inappropriate Content
Hi Paul -
Thanks for the help. I'm afraid that syntax returns no values:
NM
- Mark as New
- Bookmark Message
- Subscribe to Message
- Mute Message
- Subscribe to RSS Feed
- Permalink
- Report Inappropriate Content
@neilmac64 Sorry had a typo in my search. I corrected my origin post. Please try it again.
- Mark as New
- Bookmark Message
- Subscribe to Message
- Mute Message
- Subscribe to RSS Feed
- Permalink
- Report Inappropriate Content
Same result I'm afraid - nothing found
- Mark as New
- Bookmark Message
- Subscribe to Message
- Mute Message
- Subscribe to RSS Feed
- Permalink
- Report Inappropriate Content
Hi @neilmac64 your field key is not a numeric value but you must use a numeric field to calculate the delta.
Could you provide a sample event and check my search with generated test data?
| makeresults count=8
| streamstats count
| eval key = case(count=1, "10", count=2, "12", count=3, "12", count=4, "13", count=5, "20", count=6, "21", count=7, "21", count=8, "23")
| eval _time= case(count=1, "1673274655", count=2, "1673273755", count=3, "1673272855", count=4, "1673271955", count=5, "1673271055", count=6, "1673270155", count=7, "1673269255", count=8, "1673268355")
| eval mac_address = case(count=1 OR count=5 OR count=2, "01-00-5e-00-00-02", count=2, "01-00-5e-00-00-00", count=3, "01-00-5e-7f-ff-fe", count=4, "01-00-5e-7f-ff-ff", count=5, "01-00-5e-00-00-20", count=6, "01-00-5e-00-00-30", count=7, "01-00-5e-00-00-40", count=8, "01-00-5e-00-00-50")
| delta key as delta_01
| timechart span=15m values(delta_01) by mac_address