- Find Answers
- :
- Using Splunk
- :
- Splunk Search
- :
- How to change timechart default Y axis default sca...
- Subscribe to RSS Feed
- Mark Topic as New
- Mark Topic as Read
- Float this Topic for Current User
- Bookmark Topic
- Subscribe to Topic
- Mute Topic
- Printer Friendly Page
- Mark as New
- Bookmark Message
- Subscribe to Message
- Mute Message
- Subscribe to RSS Feed
- Permalink
- Report Inappropriate Content
How to change timechart default Y axis default scale?
Hi,Splunkers,
I have a timechart, which have value for count by VQ less than 10, but default y axis scale is 100, which causes I can't see any column in my timechart.
how to change the y Axis scale to adjust automatically to my maximum value,
for example, if max value is less than 10, than default scale should be 10.
thx in advance.
kevin
- Mark as New
- Bookmark Message
- Subscribe to Message
- Mute Message
- Subscribe to RSS Feed
- Permalink
- Report Inappropriate Content
thx, it looks a little complicated for me.
still not sure why my other timechart works as expected.
I will do more research.
thank you very much.
Kevin
- Mark as New
- Bookmark Message
- Subscribe to Message
- Mute Message
- Subscribe to RSS Feed
- Permalink
- Report Inappropriate Content
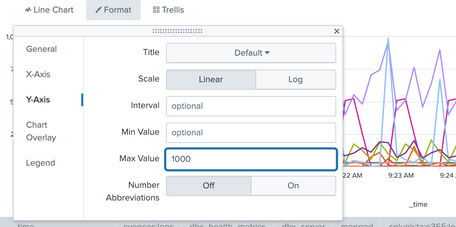
@wangkevin1029 - You can use the max value in the line chart on Y-Axis.
Consider upvoting if this helps!!!
- Mark as New
- Bookmark Message
- Subscribe to Message
- Mute Message
- Subscribe to RSS Feed
- Permalink
- Report Inappropriate Content

this is not working one, total aggragation result is 22, max value is 100, which I didn't configure it.
- Mark as New
- Bookmark Message
- Subscribe to Message
- Mute Message
- Subscribe to RSS Feed
- Permalink
- Report Inappropriate Content
Vatsal,
thx for your quick response.
My splunk ver doesn't have this configuration.
however I don't want a fixed max value. I need an automatic adjust max value here.
and it works in my other splunk, I compared all visualization configuration, they are same.
not sure why other one works.
for the working one, if the largest value is 7, then max scale is 10, if the largest value is 7500, then max scale is 10000.
Kevin
- Mark as New
- Bookmark Message
- Subscribe to Message
- Mute Message
- Subscribe to RSS Feed
- Permalink
- Report Inappropriate Content
sorry, i have that max value, but I don't want a fixed max value.
Kevin
- Mark as New
- Bookmark Message
- Subscribe to Message
- Mute Message
- Subscribe to RSS Feed
- Permalink
- Report Inappropriate Content
@wangkevin1029 - Then you probably can try doing it under XML by setting it as a token and dynamically generating the token value as the max value.
some reference:
        <search>
          <query>...</query>
          ...
          <done>
            <set token="tkn_max_value">$result.max_value$</set>
          </done>
        </search>
* Option for max value: "charting.axisX.maximumNumber"
<chart>
  <search> ... ..
  ...
  <option name="charting.axisX.maximumNumber">$tkn_max_value$</option>
</chart>
* See more references - in Splunk's Simple XML reference document.
PS: I have personally not tried with chart configuration parameter but the token works with table options.
I hope this helps!!


