Join the Conversation
- Find Answers
- :
- Using Splunk
- :
- Splunk Search
- :
- How to calculate downtime based on the amount of r...
- Subscribe to RSS Feed
- Mark Topic as New
- Mark Topic as Read
- Float this Topic for Current User
- Bookmark Topic
- Subscribe to Topic
- Mute Topic
- Printer Friendly Page
- Mark as New
- Bookmark Message
- Subscribe to Message
- Mute Message
- Subscribe to RSS Feed
- Permalink
- Report Inappropriate Content
How to calculate downtime based on the amount of requests an application server processes?
Hi guys. I want to be able to calculate downtime based on the amount of requests that an Application server processes. The downtime is calculated based on the following rules.
- Choose a time-span 30 min before and 30 min after the actual downtime.
- Calculate the average amount of events based on the top 20 results i.e the 20 minutes with the most amount of processed requests.
- Cassify all events as downtime that has 80% or below of the average described in step 2 above.
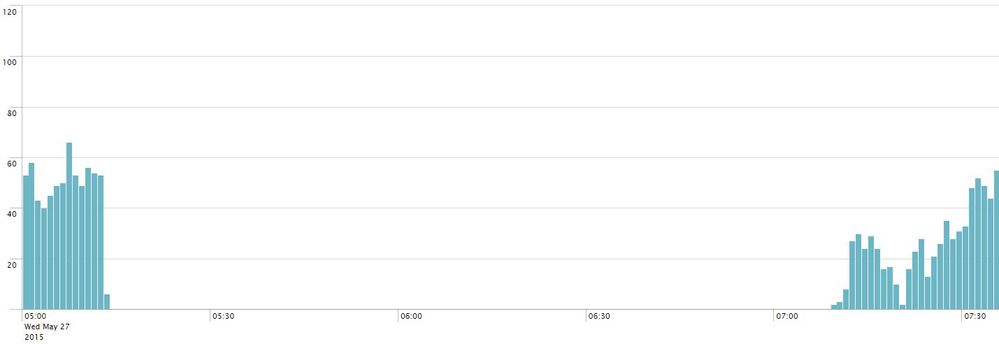
Below is an example of the result I want to calculate downtime on:
- Mark as New
- Bookmark Message
- Subscribe to Message
- Mute Message
- Subscribe to RSS Feed
- Permalink
- Report Inappropriate Content
Here is my method to get the top 80% count, using the percentile top 80% counts, and qualify every minute as up or downtime based on this value.
index=_internal source=*web* req_time =*
|  bucket _time span=1m | stats count by _time
| eventstats perc80(count) AS maxperc80
| eval status=if(count < maxperc80, "down", "up")
You probably want to add some sort of count of consecutive durations and exclude the outliers
Then do the sum of the "down" minutes.
| stats count by status
- Mark as New
- Bookmark Message
- Subscribe to Message
- Mute Message
- Subscribe to RSS Feed
- Permalink
- Report Inappropriate Content
...|top 20 status| stats avg(count)
- Mark as New
- Bookmark Message
- Subscribe to Message
- Mute Message
- Subscribe to RSS Feed
- Permalink
- Report Inappropriate Content
hi, one more things. how do we add step number 2 above to the search where we take the average of the top 20 results.
- Mark as New
- Bookmark Message
- Subscribe to Message
- Mute Message
- Subscribe to RSS Feed
- Permalink
- Report Inappropriate Content
I know this is not what you are asking but, based on your example which shows an obvious 100% (full vs. partial) outage, why would you not use something like this:
... | streamstats current=f latest(_time) AS prevEventTime latest(_raw) AS prevEvent | eval downtime = _time - _prevEventTime | where downtime > 100
- Mark as New
- Bookmark Message
- Subscribe to Message
- Mute Message
- Subscribe to RSS Feed
- Permalink
- Report Inappropriate Content
Thanks for your input. I have something similar in-place already, however point number 2 above is an important part of the search to be able to calculate the downtime in a proper way.

