Are you a member of the Splunk Community?
- Find Answers
- :
- Using Splunk
- :
- Splunk Search
- :
- How to calculate concurrent operations on a server...
- Subscribe to RSS Feed
- Mark Topic as New
- Mark Topic as Read
- Float this Topic for Current User
- Bookmark Topic
- Subscribe to Topic
- Mute Topic
- Printer Friendly Page
- Mark as New
- Bookmark Message
- Subscribe to Message
- Mute Message
- Subscribe to RSS Feed
- Permalink
- Report Inappropriate Content
How to calculate concurrent operations on a server in a timechart?
Hi,
I'm trying to show the concurrent number of 2 operations(eg, data 'export', and data 'import') on a server in a time chart .
Here is my log looks like:
2018-05-08T06:02:31 id=1 type=chunk_data
 2018-05-08T06:02:32 id=1 type=export_chunk
 2018-05-08T06:02:32 id=2 type=import_data
 2018-05-08T06:02:32 id=1 type=export_chunk
2018-05-08T06:02:33 id=1 type=export_chunk
2018-05-08T06:02:33 id=1 type=export_chunk
2018-05-08T06:02:33 id=2 type=post_import
2018-05-08T06:02:34 id=2 type=post_import_cleanup
The export operation include the following 2 stages:
- chunking data first, which defined by
type=chunk_datain the log - then export chunked data concurrently, which specified by multiple log events with
type=export_chunk
The import operation include the following stages:
- import data, with
type=import_datain the log - post import, with
type=post_importin the log - clean up, with
type=post_import_cleanupin the log
So the expected output in the following search ranges:
- if from
2018-05-08T06:02:31--2018-05-08T06:02:34, 1 export and 1 import - if from
2018-05-08T06:02:32--2018-05-08T06:02:34, 1 export and 1 import. in this case, we don't havetype=chunk_datawithin the search range, but still should consider there was 1 export operation - if from
2018-05-08T06:02:32--2018-05-08T06:02:33, 1 export and 1 import. In this case, we don't havetype=post_import_cleanupin the search range, but still should consider 1 ongoing import.
I'm new to Splunk and trying to use transaction command, but having trouble to figure out the query.
Any input would be highly appreciated!
- Mark as New
- Bookmark Message
- Subscribe to Message
- Mute Message
- Subscribe to RSS Feed
- Permalink
- Report Inappropriate Content
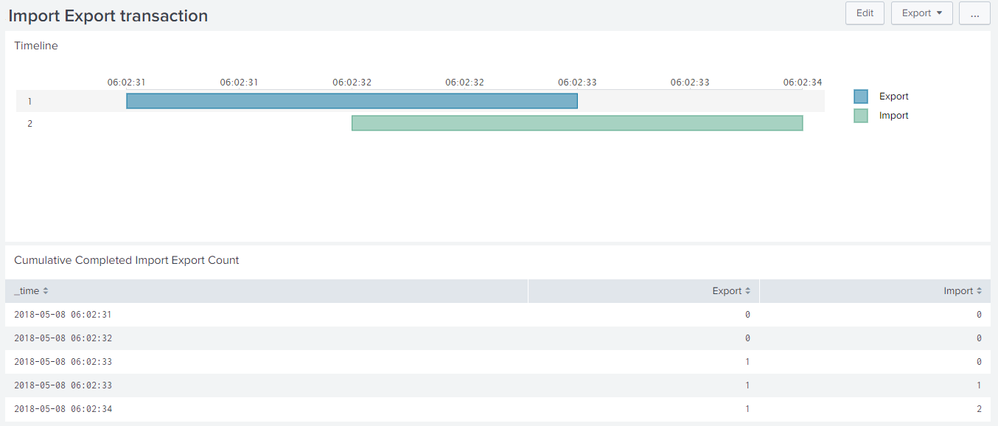
@jackie_1001, ideally you should use Timeline Custom Visualization to depict this kind of transaction over time.
And while you can use transaction to correlate events stats (or rather streamstats in your case) may be a better option. Refer to documentation: https://docs.splunk.com/Documentation/Splunk/latest/Search/Abouteventcorrelation
While I am not able to grasp the criteria for Time Window that you have come up with please try the following run anywhere examples (1) Uses Timeline Custom Visualization to show completed Import and Export. (2) Show cumulative Import and Export using streamstats command.
Simple XML Dashboard code with Run Anywhere example based on sample data in the question.
<dashboard>
  <label>Import Export transaction</label>
  <row>
    <panel>
      <title>Timeline</title>
      <viz type="timeline_app.timeline">
        <search>
          <query>| makeresults
| eval data="2018-05-08T06:02:31 id=1 type=chunk_data;2018-05-08T06:02:32 id=1 type=export_chunk;2018-05-08T06:02:32 id=2 type=import_data;2018-05-08T06:02:32 id=1 type=export_chunk;2018-05-08T06:02:33 id=1 type=export_chunk;2018-05-08T06:02:33 id=1 type=export_chunk;2018-05-08T06:02:33 id=2 type=post_import;2018-05-08T06:02:34 id=2 type=post_import_cleanup"
| makemv data delim=";"
| mvexpand data
| rename data as _raw
| KV
| rex "^(?<_time>[^\s]+)\s"
| eval _time=strptime(_time,"%Y-%m-%dT%H:%M:%S")
| reverse
| dedup id type
| stats count as eventCount earliest(_time) as _time latest(_time) as latestTime values(type) as type by id
| search (type="chunk_data" AND type="export_chunk") OR (type="import_data" AND type="post_import")
| eval action=if(type="export_chunk","Export","Import")
| eval duration=(latestTime-_time)*1000
| eval earliestTime=strftime(_time,"%Y-%m-%d %H:%M:%S")
| eval latestTime=strftime(latestTime,"%Y-%m-%d %H:%M:%S")
| eval TimeRange=earliestTime." - ".latestTime
| table _time id action duration</query>
          <earliest>-24h@h</earliest>
          <latest>now</latest>
          <sampleRatio>1</sampleRatio>
        </search>
        <option name="drilldown">none</option>
        <option name="timeline_app.timeline.axisTimeFormat">SECONDS</option>
        <option name="timeline_app.timeline.colorMode">categorical</option>
        <option name="timeline_app.timeline.maxColor">#DA5C5C</option>
        <option name="timeline_app.timeline.minColor">#FFE8E8</option>
        <option name="timeline_app.timeline.numOfBins">6</option>
        <option name="timeline_app.timeline.tooltipTimeFormat">SECONDS</option>
        <option name="timeline_app.timeline.useColors">1</option>
        <option name="trellis.enabled">0</option>
        <option name="trellis.scales.shared">1</option>
        <option name="trellis.size">medium</option>
      </viz>
    </panel>
  </row>
  <row>
    <panel>
      <title>Cumulative Completed Import Export Count</title>
      <table>
        <search>
          <query>| makeresults
| eval data="2018-05-08T06:02:31 id=1 type=chunk_data;2018-05-08T06:02:32 id=1 type=export_chunk;2018-05-08T06:02:32 id=2 type=import_data;2018-05-08T06:02:32 id=1 type=export_chunk;2018-05-08T06:02:33 id=1 type=export_chunk;2018-05-08T06:02:33 id=1 type=export_chunk;2018-05-08T06:02:33 id=2 type=post_import;2018-05-08T06:02:34 id=2 type=post_import_cleanup"
| makemv data delim=";"
| mvexpand data
| rename data as _raw
| KV
| rex "^(?<_time>[^\s]+)\s"
| eval _time=strptime(_time,"%Y-%m-%dT%H:%M:%S")
| reverse
| dedup id type
| reverse
| streamstats earliest(_time) as earliestTime latest(_time) as latestTime values(type) as type by id
| eval _time=latestTime
| eval action= case((type="chunk_data" AND type="export_chunk"),"Export",(type="import_data" AND type="post_import"),"Import",true(),"NA")
| eval count= if((type="chunk_data" AND type="export_chunk") OR (type="import_data" AND type="post_import"),1,0)
| streamstats count(eval(action="Export")) as Export count(eval(action="Import")) as Import
| table _time Export Import</query>
          <earliest>1525739400</earliest>
          <latest>1525740300</latest>
          <sampleRatio>1</sampleRatio>
        </search>
        <option name="count">20</option>
        <option name="dataOverlayMode">none</option>
        <option name="drilldown">none</option>
        <option name="percentagesRow">false</option>
        <option name="refresh.display">progressbar</option>
        <option name="rowNumbers">false</option>
        <option name="totalsRow">false</option>
        <option name="wrap">true</option>
      </table>
    </panel>
  </row>
</dashboard>
| makeresults | eval message= "Happy Splunking!!!"
- Mark as New
- Bookmark Message
- Subscribe to Message
- Mute Message
- Subscribe to RSS Feed
- Permalink
- Report Inappropriate Content
Hi @niketnilay, thanks so much for your response, it's very helpful!
I'm looking at 1-hour time window to show the concurrent numbers of import and export.
For the ' (2) Show cumulative Import and Export using streamstats command.', the result shows 2 import at '2018-05-08T06:02:34' timestamp. With 1-hour time window, the output would be 1 import and 1 export. I'm trying to update the query to get the expected result, but still no succeed. Could you help?
Thanks!
- Mark as New
- Bookmark Message
- Subscribe to Message
- Mute Message
- Subscribe to RSS Feed
- Permalink
- Report Inappropriate Content
@jackie_1001, can you try to change the second streamstats with timechart with span=1h i.e. | streamstats count(eval(action="Export")) as Export count(eval(action="Import")) as Import with:
| timechart span=1h count(eval(action="Export")) as Export count(eval(action="Import")) as Import
| makeresults | eval message= "Happy Splunking!!!"
- Mark as New
- Bookmark Message
- Subscribe to Message
- Mute Message
- Subscribe to RSS Feed
- Permalink
- Report Inappropriate Content
Clarification:
The start of export operation can be identified by type=chunk_data, and the end of it can be identified by the last instance of type=export_chunk.
The start of the import operation can identified by type=import_data, and the end of it can be type=post_import_clean_up

