Join the Conversation
- Find Answers
- :
- Using Splunk
- :
- Splunk Search
- :
- How do I edit my search to convert a string to a n...
- Subscribe to RSS Feed
- Mark Topic as New
- Mark Topic as Read
- Float this Topic for Current User
- Bookmark Topic
- Subscribe to Topic
- Mute Topic
- Printer Friendly Page
- Mark as New
- Bookmark Message
- Subscribe to Message
- Mute Message
- Subscribe to RSS Feed
- Permalink
- Report Inappropriate Content
How do I edit my search to convert a string to a numeric value to display a graph?
Hi!
I'm indexing XML data containing free memory values and get a nice stats table, but not be able to show that as a graph because Splunk interprets memory values as strings.
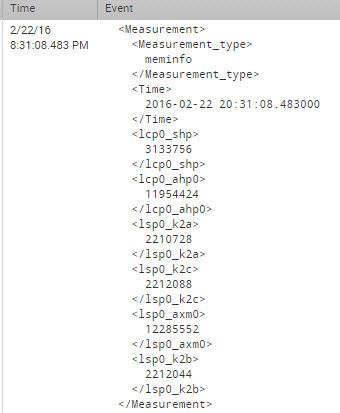
My event example is attached.
I tried to convert string to numbers, but didn't succeed.
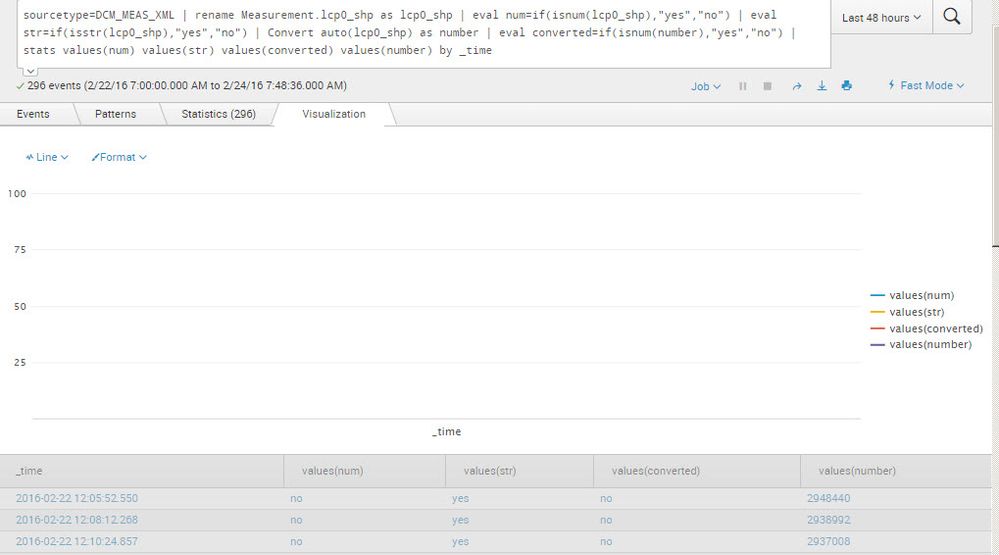
sourcetype=DCM_MEAS_XML | rename Measurement.lcp0_shp as lcp0_shp | eval num=if(isnum(lcp0_shp),"yes","no") | eval str=if(isstr(lcp0_shp),"yes","no") | Convert num(lcp0_shp) as number | eval converted=if(isnum(number),"yes","no") | stats values(num) values(str) values(converted) values(number) by _time
This gave me following output:
_time                    values(num)   values(str   )values(converted)   values(number)
2016-02-22 19:41:28.359   no            yes        no                 2976716
Sample event:
- Mark as New
- Bookmark Message
- Subscribe to Message
- Mute Message
- Subscribe to RSS Feed
- Permalink
- Report Inappropriate Content
Hi!
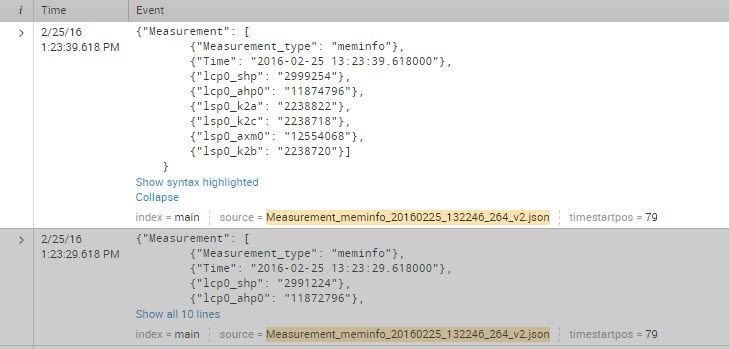
I changed the file to json format and split it so that one file contains only measurements done in one time value (vs earlier several measurements in one file which was split to separated measurement events in sourcetype).
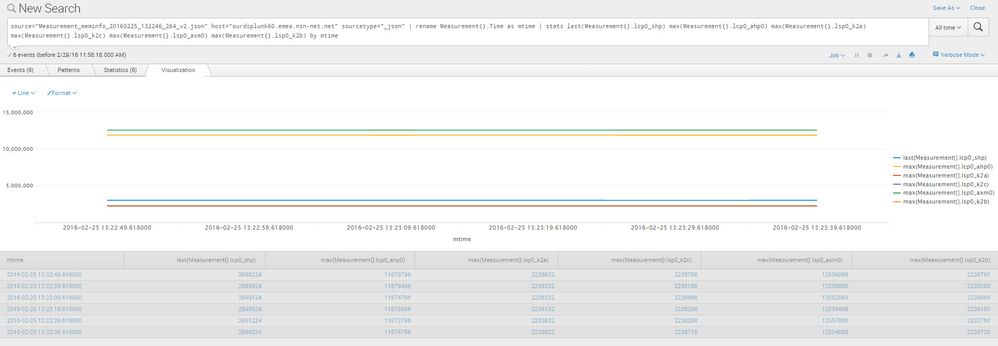
Now I'm able to draw a graph using search command:
source="Measurement_meminfo_20160225_132246_264_v2.json" host="ourdsplunk60.emea.nsn-net.net" sourcetype="_json" | rename Measurement{}.Time as mtime | stats last(Measurement{}.lcp0_shp) max(Measurement{}.lcp0_ahp0) max(Measurement{}.lsp0_k2a) max(Measurement{}.lsp0_k2c) max(Measurement{}.lsp0_axm0) max(Measurement{}.lsp0_k2b) by mtime
Maybe we need still improve the json file but anyway this is already working. Thanks for your help!
Regards,
Hannu
- Mark as New
- Bookmark Message
- Subscribe to Message
- Mute Message
- Subscribe to RSS Feed
- Permalink
- Report Inappropriate Content
try :
sourcetype=DCM_MEAS_XML | rename Measurement.lcp0_shp as lcp0_shp | eval num=if(isnum(lcp0_shp),"yes","no") | eval str=if(isstr(lcp0_shp),"yes","no") | Convert auto(lcp0_shp) as number | eval converted=if(isnum(number),"yes","no") | stats values(num) values(str) values(converted) values(number) by _time
- Mark as New
- Bookmark Message
- Subscribe to Message
- Mute Message
- Subscribe to RSS Feed
- Permalink
- Report Inappropriate Content
Hi!
Yes I did but same result.
Regards,
Hannu
- Mark as New
- Bookmark Message
- Subscribe to Message
- Mute Message
- Subscribe to RSS Feed
- Permalink
- Report Inappropriate Content
- Mark as New
- Bookmark Message
- Subscribe to Message
- Mute Message
- Subscribe to RSS Feed
- Permalink
- Report Inappropriate Content
I notice you're running the search in Fast Mode - have you tried it in Smart Mode instead?
- Mark as New
- Bookmark Message
- Subscribe to Message
- Mute Message
- Subscribe to RSS Feed
- Permalink
- Report Inappropriate Content
Can you confirm you get no visualisation for the following search?
sourcetype=DCM_MEAS_XML | timechart max(Measurement.lcp0_shp)
I tried to replicate your issue with the following search :
|gentimes start=-1 | fields - endhuman endtime starthuman | eval lcp0_shp="123456 " | eval num=if(isnum(lcp0_shp),"yes","no") | eval str=if(isstr(lcp0_shp),"yes","no") | convert num(lcp0_shp) as number | eval converted=if(isnum(number),"yes","no") | stats values(num) values(str) values(converted) values(number) by starttime
but it looks perfectly fine:
starttime   values(num) values(str) values(converted)   values(number)
1456128000  no            yes                   yes     123456
Can you run my gentimes search as well to see if you get the same output?
- Mark as New
- Bookmark Message
- Subscribe to Message
- Mute Message
- Subscribe to RSS Feed
- Permalink
- Report Inappropriate Content
Hi!
I suppose that my problem is that those measurements are not connected to _time which I have tried to use. I suppose I should use Time event and somehow combine measurements to measurement Time to be able to draw a graph. Do you have any proposal how to do it?
Regards,
Hannu
- Mark as New
- Bookmark Message
- Subscribe to Message
- Mute Message
- Subscribe to RSS Feed
- Permalink
- Report Inappropriate Content
I am flummoxed. I can't see why you get no values.
Even a straight sourcetype=DCM_MEAS_XML | table _time Measurement.lcp0_shp should give you a visualisation. Any chance you can post raw data so we can try and replicate the issue?
- Mark as New
- Bookmark Message
- Subscribe to Message
- Mute Message
- Subscribe to RSS Feed
- Permalink
- Report Inappropriate Content
Hi!
This looks still the same no visualisation. I found a workaround but it's not yet visible here.
Regards,
Hannu
- Mark as New
- Bookmark Message
- Subscribe to Message
- Mute Message
- Subscribe to RSS Feed
- Permalink
- Report Inappropriate Content
Hi!
sourcetype=DCM_MEAS_XML | chart _time Measurement.lcp0_shp
gave me an error message 🙂
but your gentimes search gave exactly same result than for you.
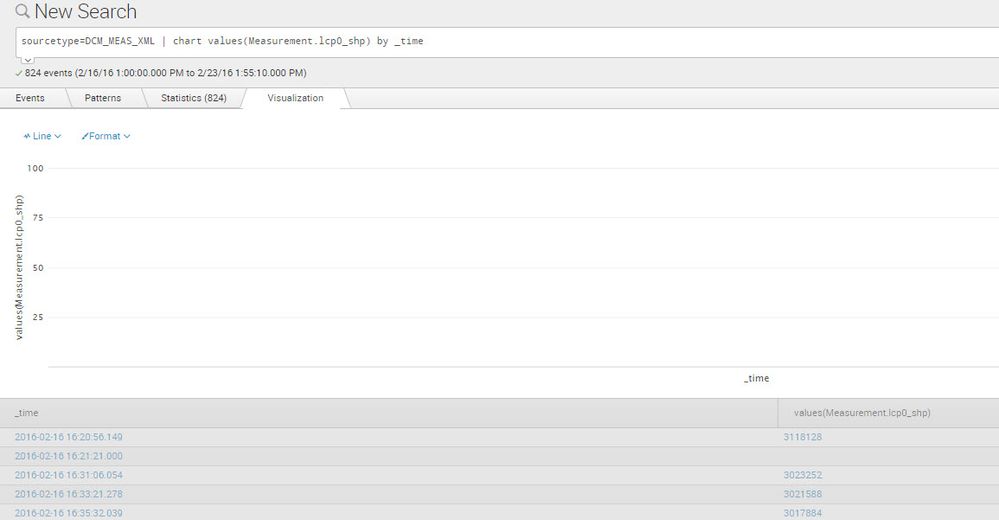
sourcetype=DCM_MEAS_XML | chart values(Measurement.lcp0_shp) by _time
search didn't give any visualization for me. Please see the attachment.
- Mark as New
- Bookmark Message
- Subscribe to Message
- Mute Message
- Subscribe to RSS Feed
- Permalink
- Report Inappropriate Content
Sorry I typod the first search. That should have been a timechart max() can you try it again?
- Mark as New
- Bookmark Message
- Subscribe to Message
- Mute Message
- Subscribe to RSS Feed
- Permalink
- Report Inappropriate Content
Hi!
Unfortunately neither this didn't solve my problem.
Regards,
Hannu
