Join the Conversation
- Find Answers
- :
- Using Splunk
- :
- Splunk Search
- :
- How do I count certain field values by row and cov...
- Subscribe to RSS Feed
- Mark Topic as New
- Mark Topic as Read
- Float this Topic for Current User
- Bookmark Topic
- Subscribe to Topic
- Mute Topic
- Printer Friendly Page
- Mark as New
- Bookmark Message
- Subscribe to Message
- Mute Message
- Subscribe to RSS Feed
- Permalink
- Report Inappropriate Content
I've been plugging away at this for a few days and I'm stuck =0(
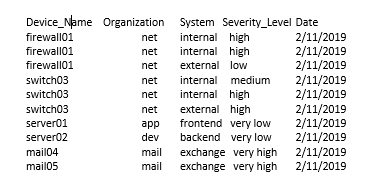
Above is a lookup csv (insert dummy data) I have from Nessus. I am trying to use Splunk to create totals of vulnerability severity levels in two separate tables, one by organization and another by system.
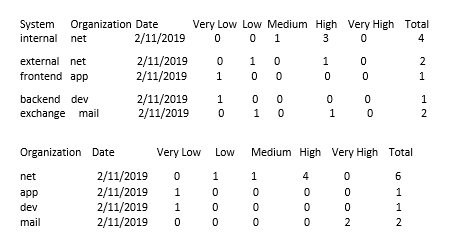
Below is what I want to do, any ideas how to do this?
Lastly, I’m trying to use the newly created tables and make two time graphs on vulnerability severity level totals by organization/date and another graph by system/date. Scans are run everyday, so inevitability the totals will change over time, which is what I'm trying to capture with the time-charts.
Any ideas? Thanks!
- Mark as New
- Bookmark Message
- Subscribe to Message
- Mute Message
- Subscribe to RSS Feed
- Permalink
- Report Inappropriate Content
You can convert data which is like table 1 to table 2 and table 3 like this
Table 2
your current search with field DeviceName Organization System Severity_Level Date
| eval temp=Organization."###".System."###".Date
| chart count over temp by Severity_Level | addtotals
| rex field=temp "(?<Organization>.+)###(?<System>.+)###(?<Date>.+)" | fields - temp
| table System Organization Date *
For timechart, add this to above search
| eval _time=strptime(Date,"%m/%d/%Y")
| timechart sum(Total) by System
Table 3
your current search with field DeviceName Organization System Severity_Level Date
| eval temp=Organization."###".Date
| chart count over temp by Severity_Level | addtotals
| rex field=temp "(?<Organization>.+)###(?<Date>.+)" | fields - temp
| table Organization Date *
For timechart, add this to above search
| eval _time=strptime(Date,"%m/%d/%Y")
| timechart sum(Total) by Organization
- Mark as New
- Bookmark Message
- Subscribe to Message
- Mute Message
- Subscribe to RSS Feed
- Permalink
- Report Inappropriate Content
| makeresults
| eval _raw="Device_Name,Organization,System,Severity_Level,Date
firewall01,net,internal,high,2/11/2019
firewall01,net,internal,high,2/11/2019
firewall01,net,external,low,2/11/2019
switch03,net,internal,medium,2/11/2019
switch03,net,internal,high,2/11/2019
switch03,net,external,high,2/11/2019
server01,app,frontend,very low,2/11/2019
server02,dev,backend,very low,2/11/2019
mail04,mail,exchange,very high,2/11/2019
mail05,mail,exchange,very high,2/11/2019"
| multikv forceheader=1
| table Device_Name,Organization,System,Severity_Level,Date
| stats count(eval(Severity_Level="very low")) as "Very Low"
,count(eval(Severity_Level="low")) as "Low"
,count(eval(Severity_Level="medium")) as "Mediun"
,count(eval(Severity_Level="high")) as "High"
,count(eval(Severity_Level="very high")) as "Very High"
,count as "Total" by System Organization Date
| appendpipe [ | rename System as _System
| stats sum(*) as * by Organization Date]
Hi, @UMDTERPS
Why log with images? This is quite hindering the answer.
- Mark as New
- Bookmark Message
- Subscribe to Message
- Mute Message
- Subscribe to RSS Feed
- Permalink
- Report Inappropriate Content
Hey @to4kawa
When I copy paste into Splunk answers, it does not keep the formatting (if I try changing it, and hit submit -it changes again). I thought it would b easier to understand that way.
Cheers
- Mark as New
- Bookmark Message
- Subscribe to Message
- Mute Message
- Subscribe to RSS Feed
- Permalink
- Report Inappropriate Content
You can convert data which is like table 1 to table 2 and table 3 like this
Table 2
your current search with field DeviceName Organization System Severity_Level Date
| eval temp=Organization."###".System."###".Date
| chart count over temp by Severity_Level | addtotals
| rex field=temp "(?<Organization>.+)###(?<System>.+)###(?<Date>.+)" | fields - temp
| table System Organization Date *
For timechart, add this to above search
| eval _time=strptime(Date,"%m/%d/%Y")
| timechart sum(Total) by System
Table 3
your current search with field DeviceName Organization System Severity_Level Date
| eval temp=Organization."###".Date
| chart count over temp by Severity_Level | addtotals
| rex field=temp "(?<Organization>.+)###(?<Date>.+)" | fields - temp
| table Organization Date *
For timechart, add this to above search
| eval _time=strptime(Date,"%m/%d/%Y")
| timechart sum(Total) by Organization
- Mark as New
- Bookmark Message
- Subscribe to Message
- Mute Message
- Subscribe to RSS Feed
- Permalink
- Report Inappropriate Content
Your Answer works! Thank you! =0)
A programmer at work said an easier way might be this ( I will mark your answer correct):
|inputlookup Nessus.csv
|eval Date = strptime(Date, "%m/%d/%Y")
| search Status="Ongoing"
| chart count by Date System
| eval Date = strftime(Date, "%m/%d/%Y")


