Join the Conversation
- Find Answers
- :
- Using Splunk
- :
- Splunk Search
- :
- How can we show or display application response ti...
- Subscribe to RSS Feed
- Mark Topic as New
- Mark Topic as Read
- Float this Topic for Current User
- Bookmark Topic
- Subscribe to Topic
- Mute Topic
- Printer Friendly Page
- Mark as New
- Bookmark Message
- Subscribe to Message
- Mute Message
- Subscribe to RSS Feed
- Permalink
- Report Inappropriate Content
How can we show or display application response time based on session id?
hi,
we running load test on 6 of the micro services and each has different API. we are indexing those logs into Splunk for monitoring.
log has a details like org name,app name,session id,uri,msg,ResponseTime,ResponseCode etc
i extracted all them in Splunk and each has some values.
session id we can find after endpoint
/public/sso/keepalive|79BF94E2-8165-b302-2869-28cc942d6e
/public/sso/keepalive|79BF94E2-8165-b302-2869-28cc942d6e
incoming flow always starts from application app-ca-sit and makes a call to app-sso-sit, this process and complete the request and see this app alone responsetime in 2nd log
1st log also shows responsetime but it gives you the total response time of both micro services.
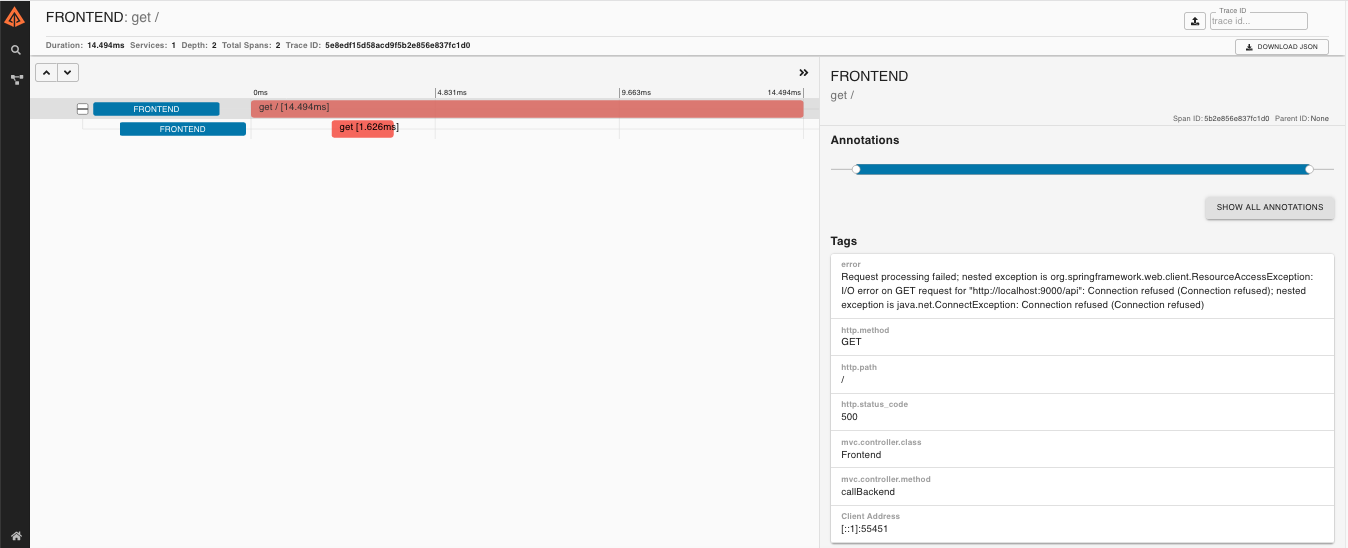
how can we show or display application response times in order? i am attaching sample diagram which has a good understanding.
<6>2017-01-25T22:47:16Z 0ke4hjl7eph doppler[22]: {"cf_app_id":"012b7380-c96c-46e6-a57e-b96fd1f7266c","cf_app_name":"app-ca-sit","cf_ignored_app":false,"cf_org_id":"fd12558e-ddaf-4dd2-91b3-85f28ccd27f3","cf_org_name":"SYSTEM","cf_origin":"firehose","cf_space_id":"f9e2c3b9-ff7a-46b2-b359-9ec4ec13487b","cf_space_name":"lab","deployment":"cf","event_type":"LogMessage","ip":"168.72.186.55","job":"diego_cell-partition-ee9c6bad3843f162447f","job_index":"6","level":"info","message_type":"OUT","msg":" INFO [nio-8080-exec-3] c.c.c.l.c.f.CCPLoggingContextFilter      c.c.c.l.c.f.CCPLoggingContextFilter.postProcess(CCPLoggingContextFilter.java:187) - POST|/public/sso/keepalive|79BF94E2-8165-b302-2869-28cc942d6e|9207ccf1-056e-41f9-be87-72e702ddf93c|US|GCB|MBK||METRICS|ResponseCode=200|ResponseTime=53","origin":"rep","source_instance":"0","source_type":"APP","time":"2017-01-25T22:47:16Z","timestamp":1485384436814105817}

<6>2017-01-25T22:47:16Z v2d4vnhslen doppler[19]: {"cf_app_id":"6b3e0a17-c90e-4921-8bb5-d01dbc4fc768","cf_app_name":"app-sso-sit","cf_ignored_app":false,"cf_org_id":"fd12558e-ddaf-4dd2-91b3-85f28ccd27f3","cf_org_name":"SYSTEM","cf_origin":"firehose","cf_space_id":"f9e2c3b9-ff7a-46b2-b359-9ec4ec13487b","cf_space_name":"lab","deployment":"cf","event_type":"LogMessage","ip":"168.72.186.50","job":"diego_cell-partition-ee9c6bad3843f162447f","job_index":"1","level":"info","message_type":"OUT","msg":" INFO [io-8080-exec-18] c.c.c.l.c.f.CCPLoggingContextFilter      c.c.c.l.c.f.CCPLoggingContextFilter.postProcess(CCPLoggingContextFilter.java:187) - POST|/public/sso/keepalive|79BF94E2-8165-b302-2869-28cc942d6e|9207ccf1-056e-41f9-be87-72e702ddf93c|US|GCB|MBK||METRICS|ResponseCode=200|ResponseTime=44","origin":"rep","source_instance":"0","source_type":"APP","time":"2017-01-25T22:47:16Z","timestamp":1485384436812148138}
- Mark as New
- Bookmark Message
- Subscribe to Message
- Mute Message
- Subscribe to RSS Feed
- Permalink
- Report Inappropriate Content
If all you want is the response time for each app for a particular api url within a gien session id, then you can try this:
your query to return event
| rex "cf_app_name":"(?<appName>[^\"]+).+(GET|POST)\|(?<uri>[^\|]+)\|(?<sessionId>[^\|]+).+ResponseTime=(?<responseTime>[^\"]+).+timestamp\":(?<timestamp>[^}]+)"
| table appName, uri, responseTime, sessionId, timestamp
| sort sessionId, -timestamp
- Mark as New
- Bookmark Message
- Subscribe to Message
- Mute Message
- Subscribe to RSS Feed
- Permalink
- Report Inappropriate Content
Hi,
I was able to display them in table with my already extracted fileds in splunk instance
Can we display them in any charts other than table?
- Mark as New
- Bookmark Message
- Subscribe to Message
- Mute Message
- Subscribe to RSS Feed
- Permalink
- Report Inappropriate Content
You can display them in time hart like
| timechart avg(responseTime) by appName
Or maybe on uri. Explore with functions like min, max, avg etc in time chart.
If you like you can represent pie chart of percentage of appName and so on...
- Mark as New
- Bookmark Message
- Subscribe to Message
- Mute Message
- Subscribe to RSS Feed
- Permalink
- Report Inappropriate Content
Join the Splunk Community Slack to learn, troubleshoot, and make connections with fellow Splunk practitioners in real time!
Join Splunk User Groups to connect and learn in-person by region or remotely by topic or industry.
[Puzzles] Solve, Learn, Repeat: Matching cron expressions
Design, Compete, Win: Submit Your Best Splunk Dashboards for a .conf26 Pass
May 2026 Splunk Expert Sessions: Security & Observability
