Are you a member of the Splunk Community?
- Find Answers
- :
- Using Splunk
- :
- Splunk Search
- :
- How can I write a timechart search with transactio...
- Subscribe to RSS Feed
- Mark Topic as New
- Mark Topic as Read
- Float this Topic for Current User
- Bookmark Topic
- Subscribe to Topic
- Mute Topic
- Printer Friendly Page
- Mark as New
- Bookmark Message
- Subscribe to Message
- Mute Message
- Subscribe to RSS Feed
- Permalink
- Report Inappropriate Content
How can I write a timechart search with transaction to compare sessions over time (John the Ripper logs)?
Few days ago, a developer has added to John the Ripper the ability to timestamp every line of logs, allowing me to feed them to Splunk in order to derive statistics from this data.
JtR's logs are complex, starting with a header of several lines giving details about the current session:
2016-02-23T20:43:57+0100 1 0:00:00:00 Starting a new session
2016-02-23T20:43:57+0100 1 0:00:00:00 Loaded a total of 15151 password hashes with 15151 different salts
2016-02-23T20:43:57+0100 1 0:00:00:00 Sorting salts, for performance
2016-02-23T20:43:57+0100 1 0:00:00:00 Remaining 14755 password hashes with 14755 different salts
2016-02-23T20:43:57+0100 1 0:00:00:00 - Node numbers 1-4 of 4 (fork)
2016-02-23T20:43:57+0100 1 0:00:00:00 Command line: ./john --fork=4 --wordlist=password.lst --rules=JUMBO dump.txt
2016-02-23T20:43:57+0100 1 0:00:00:00 - UTF-8 input encoding enabled
2016-02-23T20:43:57+0100 1 0:00:00:00 - Passwords will be stored UTF-8 encoded in .pot file
...
After this header, each cracked password yields to a new line, and periodically an info line is printed:
2016-02-23T20:50:38+0100 2 0:00:06:41 + Cracked foo
2016-02-23T20:50:50+0100 1 0:00:06:53 + Cracked bar
2016-02-23T20:50:47+0100 3 0:00:06:49 + pot sync removed 2 hashes; Remaining 14583 hashes with 14583 different salts
The session can end by exhaustion (no more passwords, or no more candidates), or by interrupt (ctrl-c). Message is either:
2016-02-23T22:17:06+0100 2 0:01:33:09 Session completed
or
2016-02-24T11:03:47+0100 4 0:00:38:22 Session aborted
I would like to be able to track down and compare efficiency of different sessions. Each session has different parameters that can be read from the header ("Command line:" and other header log lines).
Efficiency can be measured as the number of "Cracked" in a given period of time. Difficulty for me is to make a timechart , chart, or stats calculation for each session from a single Splunk request so everything is displayed on one graph/chart.
I've started investigating transactions, that's quite easy with a first line containing "Starting a new session" and the last containing "Session *ted". But it seems I can't work inside a transaction to create timechart.
Any hint?
- Mark as New
- Bookmark Message
- Subscribe to Message
- Mute Message
- Subscribe to RSS Feed
- Permalink
- Report Inappropriate Content
By the way, apart from my comment above, if i were you I would try to write a very detailed parsing for these logs using the documentation (if there's any). That way you can classify your events, create macros and use more powerful features.
- Mark as New
- Bookmark Message
- Subscribe to Message
- Mute Message
- Subscribe to RSS Feed
- Permalink
- Report Inappropriate Content
Hi,
If you replace transaction with streamstats + stats you should be able to gain some extra control that you can use for your own benefit.
I've written the following based on your logs that replaces the use of transaction, if you could explain with an example what you are expecting to see in a tabular format it would definitely help a lot:
sourcetype="johntheripper" index=foo
| rex "^\d{4}\-\d{2}\-\d{2}T\d{2}:\d{2}:\d{2}[+|-]\d{4} \d (?<session_time_D>\d{1,2}):(?<session_time_H>\d{2}):(?<session_time_M>\d{2}):(?<session_time_S>\d{2}) (?<message_text>.+)$"
| eval message_type = case (
    match(message_text, "Starting a new session"), "SESSION_START",
    match(message_text, "Session completed") OR match(message_text, "Session aborted"), "SESSION_END",
    match(message_text, "Command line"), "COMMAND_LINE",
    match(message_text, "Cracked"), "PASSWORD_CRACKED",
    1==1, "NOT_CLASSIFIED"
)
| eval transaction_end = if(match(message_type, "SESSION_END"), 1, 0)
| eval password_cracked = if(match(message_type, "PASSWORD_CRACKED"), 1, 0)
| eval session_time = session_time_D * 86400 + session_time_H * 3600 + session_time_M * 60 + session_time_S
| reverse
| streamstats count(eval(match(message_type, "SESSION_START"))) as transaction_id
| stats
    earliest(_time) as start_time
    latest(_time) as end_time
    range(_time) as duration
    list(message_type) as message_type
    list(message_text) as message_text
    list(session_time) as session_time
    sum(password_cracked) as passwords_cracked
    sum(transaction_end) as is_transaction_closed
    by transaction_id
| where is_transaction_closed > 0
| fieldformat start_time = strftime(start_time, "%Y-%m-%d %H:%M:%S")
| fieldformat end_time = strftime(end_time, "%Y-%m-%d %H:%M:%S")
- Mark as New
- Bookmark Message
- Subscribe to Message
- Mute Message
- Subscribe to RSS Feed
- Permalink
- Report Inappropriate Content
Thanks javiergn, I guess I'm starting to understand how I could work without true transactions.
Unfortunately, as is, your code returns some very odd results that might be caused by the fact a single log file records many successive sessions. If I "zoom" to a period of time where I have only one session, the result is OK, apart from some limitation issues:
'stats' command: limit for values of field 'message_text' reached. Some values may have been truncated or ignored.
'stats' command: limit for values of field 'message_type' reached. Some values may have been truncated or ignored.
'stats' command: limit for values of field 'session_time' reached. Some values may have been truncated or ignored.
Ideally, the output would be a plot showing for each session the command line (legend for example) and number-of-cracked-pwd=f(time).
It means I need to be able to declare: while I'm inside an active session, title=my-command-line (or a part of my-command-line, like my wordlist, my passwd file…)
And then timechart count(Cracked) by title.
It's even better if I can plot every timechart with the same origin (hence every ploted session seems to start at the same time, allowing a better graphical comparison between them).
I know I can do this in just minutes with awk and gnuplot, but the result would be very static (and boring).
I've started to configure field extractions, but I'm not finished yet, I need to test every different cases (markov, incremental, wordlist, single, etc.).
- Mark as New
- Bookmark Message
- Subscribe to Message
- Mute Message
- Subscribe to RSS Feed
- Permalink
- Report Inappropriate Content
Unfortunately, as is, your code returns some very odd results that might be caused by the fact a single log file records many successive sessions.
Hi, regarding this. Do you mean there can be multiple active sessions at the same time and therefore the event lines related to those sessions could be intercalated?
If that's the case, is there any way to differentiate sessions that doesn't rely on time? Is there any sort of unique ID we can use?
- Mark as New
- Bookmark Message
- Subscribe to Message
- Mute Message
- Subscribe to RSS Feed
- Permalink
- Report Inappropriate Content
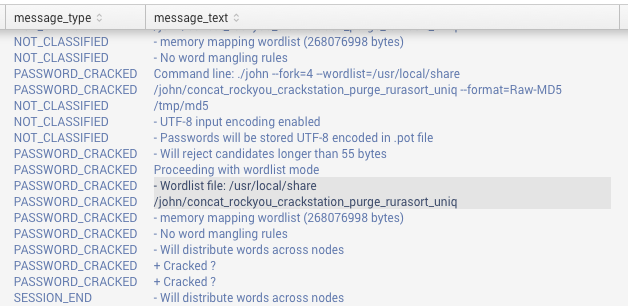
No concurrent sessions, it's only one at a time. I've just realized my mistake: the content of columns message_type and message_text are not always aligned (on a line to line basis), because message_text lines can be so long they wrap, yielding to apparent mismatch. Example in the picture :

My bad, no problem here.
- Mark as New
- Bookmark Message
- Subscribe to Message
- Mute Message
- Subscribe to RSS Feed
- Permalink
- Report Inappropriate Content
Hi @patpro,
Did you come up with a working query?
If so, can you post it here and mark it as answered so that others can benefit from it?
If you need extra assistance please do not hesitate to ask.
Thanks,
J
- Mark as New
- Bookmark Message
- Subscribe to Message
- Mute Message
- Subscribe to RSS Feed
- Permalink
- Report Inappropriate Content
Hi @javiergn
No solution yet. The more I think about this problem the less I think Splunk can handle it.
Your query properly breaks log file into cracking sessions, and classifies events, which is fine. But from here I can't plot a timechart of cracked pwds (and even though, I would have to tune Splunk so it can handle +30-50K events per cracking session).
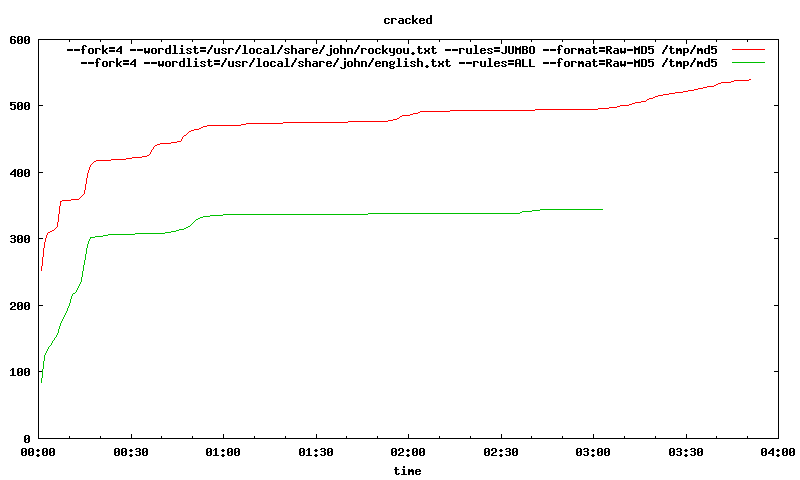
In the end of my second post, I've managed to explain a little bit more clearly what I'm trying to achieve. Tonight I've spent some time on awk/gnuplot to get the result I'm looking for.

It's rough, quick&dirty, probably won't scale very well, but the idea is here.
