Join the Conversation
- Find Answers
- :
- Using Splunk
- :
- Splunk Search
- :
- How can I represent the stats for 5 minutes before...
- Subscribe to RSS Feed
- Mark Topic as New
- Mark Topic as Read
- Float this Topic for Current User
- Bookmark Topic
- Subscribe to Topic
- Mute Topic
- Printer Friendly Page
- Mark as New
- Bookmark Message
- Subscribe to Message
- Mute Message
- Subscribe to RSS Feed
- Permalink
- Report Inappropriate Content
How can I represent the stats for 5 minutes before and the top of the hour?
I am looking to represent stats for the 5 minutes before and after the hour for an entire day/timeperiod. The search below will work but still breaks up the times into 5 minute chunks as it crosses the top of the hour.
Is there a better way to search?
index=main (earliest=01/08/2024:08:55:00 latest=01/08/2024:09:05:00) OR (earliest=01/08/2024:09:55:00 latest=01/08/2024:10:05:00) OR (earliest=01/08/2024:10:55:00 latest=01/08/2024:11:05:00) | bin _time span=10m | stats count by _time
Received results
- Mark as New
- Bookmark Message
- Subscribe to Message
- Mute Message
- Subscribe to RSS Feed
- Permalink
- Report Inappropriate Content
@mark_groenveld Is it that you simply want a single value representing the 10 minute period from x:55 to x+1:05, so you have one row per hour, e.g.
index=main (earliest=01/08/2024:08:55:00 latest=01/08/2024:09:05:00) OR (earliest=01/08/2024:09:55:00 latest=01/08/2024:10:05:00) OR (earliest=01/08/2024:10:55:00 latest=01/08/2024:11:05:00)
| bin _time span=10m aligntime=earliest
| stats count by _time
| sort _time
If so, it's just the aligntime=earliest in the bin command
- Mark as New
- Bookmark Message
- Subscribe to Message
- Mute Message
- Subscribe to RSS Feed
- Permalink
- Report Inappropriate Content
You can "cheat" a bit 🙂
Just shift your timestamps 5 minutes forward/backward, do bin over 10 minutes, then shift back 🙂
<your search>
| eval _time=_time-300
| bin _time span=10m
| eval _time=_time+300
You can also try to use the "bin" command with "align=earliest" to make it start the bin at the beginning of your search, instead of at the top of the hour.
- Mark as New
- Bookmark Message
- Subscribe to Message
- Mute Message
- Subscribe to RSS Feed
- Permalink
- Report Inappropriate Content
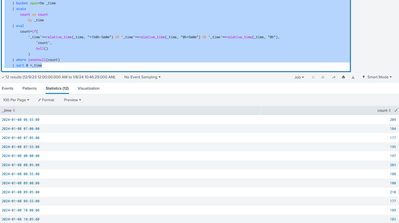
Are you wanting the the 3 5-minute buckets added together or is okay if they are separated?
You can try something like this but is still separated out into their respective 5 minute buckets.
<base_search>
    | bucket span=5m _time
    | stats
        count as count
            by _time
    | eval
        count=if(
            '_time'==relative_time(_time, "+1h@h-5m@m") OR '_time'==relative_time(_time, "@h+5m@m") OR '_time'==relative_time(_time, "@h"),
                'count',
                null()
            )
    | where isnotnull(count)
    | sort 0 +_time
Example output:
- Mark as New
- Bookmark Message
- Subscribe to Message
- Mute Message
- Subscribe to RSS Feed
- Permalink
- Report Inappropriate Content
Thanks dtburrows3 for replying. The chiefs requesting the data want 10 minute increments.
- Mark as New
- Bookmark Message
- Subscribe to Message
- Mute Message
- Subscribe to RSS Feed
- Permalink
- Report Inappropriate Content
Ahh okay,
Give this a try.
<base_search>
    | where ('_time'>=relative_time(_time, "@h-5m@m") AND '_time'<=relative_time(_time, "@h+5m@m")) OR ('_time'>=relative_time(_time, "+1h@h-5m@m") AND '_time'<=relative_time(_time, "+1h@h+5m@m"))
    | eval
        upper_hour_epoch=relative_time(_time, "+1h@h"),
        lower_hour_epoch=relative_time(_time, "@h"),
        upper_hour=strftime(relative_time(_time, "+1h@h"), "%Y-%m-%d %H:%M:%S"),
        lower_hour=strftime(relative_time(_time, "@h"), "%Y-%m-%d %H:%M:%S"),
        upper_hour_diff=abs('_time'-'upper_hour_epoch'),
        lower_hour_diff=abs('_time'-'lower_hour_epoch'),
        diff_minimum=min(upper_hour_diff, lower_hour_diff)
    | foreach *_diff
        [
            | eval
                snap_hour=if(
                    'diff_minimum'=='<<FIELD>>',
                        '<<MATCHSTR>>',
                        'snap_hour'
                    )
            ]
    | stats
        count as count,
        min(_time) as min_time,
        max(_time) as max_time
            by snap_hour
    | convert
        ctime(min_time),
        ctime(max_time)
The output should only include results +/- 5 minute window around each hour
And if you need to differentiate between the event_counts that fall in the lower 5 minutes and upper 5 minutes you could do something like this.
<base_search>
    | where ('_time'>=relative_time(_time, "@h-5m@m") AND '_time'<=relative_time(_time, "@h+5m@m")) OR ('_time'>=relative_time(_time, "+1h@h-5m@m") AND '_time'<=relative_time(_time, "+1h@h+5m@m"))
    | eval
        upper_hour_epoch=relative_time(_time, "+1h@h"),
        lower_hour_epoch=relative_time(_time, "@h"),
        upper_hour=strftime(relative_time(_time, "+1h@h"), "%Y-%m-%d %H:%M:%S"),
        lower_hour=strftime(relative_time(_time, "@h"), "%Y-%m-%d %H:%M:%S"),
        upper_hour_diff=abs('_time'-'upper_hour_epoch'),
        lower_hour_diff=abs('_time'-'lower_hour_epoch'),
        diff_minimum=min(upper_hour_diff, lower_hour_diff)
    | foreach *_diff
        [
            | eval
                snap_hour=if(
                    'diff_minimum'=='<<FIELD>>',
                        '<<MATCHSTR>>',
                        'snap_hour'
                    )
            ]
    | fields - diff_minimum, lower_hour, lower_hour_diff, lower_hour_epoch, upper_hour, upper_hour_diff, upper_hour_epoch
    | eval
        snap_hour_epoch=strptime(snap_hour, "%Y-%m-%d %H:%M:%S"),
        group=if(
            '_time'-'snap_hour_epoch'>=0,
                "+5m",
                "-5m"
            )
    | stats
        count as count
            by snap_hour_epoch, group
    | sort 0 +snap_hour_epoch
    | rename
        snap_hour_epoch as _time
Example output:
- Mark as New
- Bookmark Message
- Subscribe to Message
- Mute Message
- Subscribe to RSS Feed
- Permalink
- Report Inappropriate Content
I found a shorter example to display the result set. Thank you for your efforts dtburrows3.
| bin span=10m _time
| eval minute=strftime(_time,"%M")
| where minute>54 OR minute<6
| stats count by _time
- Mark as New
- Bookmark Message
- Subscribe to Message
- Mute Message
- Subscribe to RSS Feed
- Permalink
- Report Inappropriate Content
Just want to pop in and let you know that I think this SPL you shared is not actually capturing the minutes>55 but including the minutes between 0 and 9 just because of the way that Splunk buckets time windows.
You should be able to see this demonstrated with this SPL
<base_search>
    | eval
        true_minute=strftime(_time, "%M"),
        true_hour=strftime(_time, "%H")
    |  bin span=10m _time
    |  eval
        bucketed_minute=strftime(_time,"%M"),
        bucketed_hour=strftime(_time, "%H")
    | where 'bucketed_minute'>54 OR 'bucketed_minute'<6
    | dedup true_minute
Results I'm seeing look something like this.
To stay in the spirit of the simpler SPL and to build on your methodology, I think something like this would do the trick.
Here is sample code as a POC of the minutes being bucketed properly.
<base_search>
    | where tonumber(strftime(_time, "%M"))<=5 OR tonumber(strftime(_time, "%M"))>=55
    | eval
        date_minute=strftime(_time, "%M"),
        date_hour=strftime(_time, "%H"),
        original_time=strftime(_time, "%Y-%m-%d %H:%M:%S"),
        snap_time=case(
            'date_minute'>=55, strftime(relative_time(_time, "@h+1h"), "%Y-%m-%d %H:%M:%S"),
            'date_minute'<=5, strftime(relative_time(_time, "@h"), "%Y-%m-%d %H:%M:%S")
            )
    | fields - _time
    | fields + original_time, snap_time, date_hour, date_minute
And to use this method with your original ask it would look something like this.
<base_search>
    | where tonumber(strftime(_time, "%M"))<=5 OR tonumber(strftime(_time, "%M"))>=55
    | eval
        date_minute=strftime(_time, "%M"),
        date_hour=strftime(_time, "%H"),
        _time=case(
            'date_minute'>=55, relative_time(_time, "@h+1h"),
            'date_minute'<=5, relative_time(_time, "@h")
            )
    | stats
        count as count
            by _time
Examples:
Both 07:57 AM and 08:04 would fall into the 8:00 AM bucket in the stats count by.


