Are you a member of the Splunk Community?
- Find Answers
- :
- Using Splunk
- :
- Splunk Search
- :
- Drill down time from drill down editor to another ...
- Subscribe to RSS Feed
- Mark Topic as New
- Mark Topic as Read
- Float this Topic for Current User
- Bookmark Topic
- Subscribe to Topic
- Mute Topic
- Printer Friendly Page
- Mark as New
- Bookmark Message
- Subscribe to Message
- Mute Message
- Subscribe to RSS Feed
- Permalink
- Report Inappropriate Content
What I want to do is pass a start/end time to a table from my linechart.
On my line chart- if I click a time in the chart- it passes the clicked time perfectly.
I'd like to pass that end time & then create a start time that is 5 days earlier as tokens to drill down to a time frame.
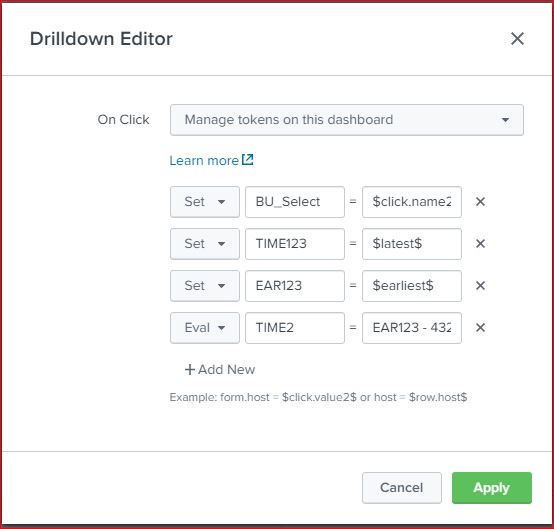
If I use the drill down editor & use the EVAL to set time-432000 (5DAYBEFORE) then the eval doesnt work
(get "No results found")
If I convert my 5DAYBEFORE to a human readible & table it.. it shows exactly the date I want to see but if I use the token in the time picker- something goes wrong.
I cant really see anything in the documentation to help w/ this example. I was hoping I could click twice & get earliest & latest & pass those 2 to my table.
Is there an easy way to drill down time tokens (current time) WITH a eval'ed time to another applet for start/end time?
My way seems to create those times perfectly.. its just that the target table wont accept EVAL to set time-432000 (5DAYBEFORE)
- Mark as New
- Bookmark Message
- Subscribe to Message
- Mute Message
- Subscribe to RSS Feed
- Permalink
- Report Inappropriate Content
Here's an example dashboard that allows you to set the number of days before the click date to then show the table for
<form>
<label>testtc</label>
<search id="base">
<query>| makeresults
| eval x=mvrange(1,100)
| mvexpand x
| eval val=random() % 100
| eval _time=_time-(x*86400)
| timechart span=1d values(val)</query>
<earliest>-24h@h</earliest>
<latest>now</latest>
<sampleRatio>1</sampleRatio>
</search>
<fieldset submitButton="false">
<input type="text" token="days" searchWhenChanged="true">
<label>Show days before click</label>
<default>5</default>
</input>
</fieldset>
<row>
<panel>
<chart>
<search base="base">
<query/>
</search>
<option name="charting.axisLabelsX.majorLabelStyle.overflowMode">ellipsisNone</option>
<option name="charting.axisLabelsX.majorLabelStyle.rotation">0</option>
<option name="charting.axisTitleX.visibility">visible</option>
<option name="charting.axisTitleY.visibility">visible</option>
<option name="charting.axisTitleY2.visibility">visible</option>
<option name="charting.axisX.abbreviation">none</option>
<option name="charting.axisX.scale">linear</option>
<option name="charting.axisY.abbreviation">none</option>
<option name="charting.axisY.scale">linear</option>
<option name="charting.axisY2.abbreviation">none</option>
<option name="charting.axisY2.enabled">0</option>
<option name="charting.axisY2.scale">inherit</option>
<option name="charting.chart">line</option>
<option name="charting.chart.bubbleMaximumSize">50</option>
<option name="charting.chart.bubbleMinimumSize">10</option>
<option name="charting.chart.bubbleSizeBy">area</option>
<option name="charting.chart.nullValueMode">gaps</option>
<option name="charting.chart.showDataLabels">none</option>
<option name="charting.chart.sliceCollapsingThreshold">0.01</option>
<option name="charting.chart.stackMode">default</option>
<option name="charting.chart.style">shiny</option>
<option name="charting.drilldown">all</option>
<option name="charting.layout.splitSeries">0</option>
<option name="charting.layout.splitSeries.allowIndependentYRanges">0</option>
<option name="charting.legend.labelStyle.overflowMode">ellipsisMiddle</option>
<option name="charting.legend.mode">standard</option>
<option name="charting.legend.placement">right</option>
<option name="charting.lineWidth">2</option>
<option name="trellis.enabled">0</option>
<option name="trellis.scales.shared">1</option>
<option name="trellis.size">medium</option>
<drilldown>
<set token="latest">$click.value$</set>
<eval token="relative_days">"-".$days$."d"</eval>
<eval token="earliest">relative_time($click.value$,$relative_days$)</eval>
<eval token="from">strftime($earliest$,"%F")</eval>
<eval token="to">strftime($latest$,"%F")</eval>
</drilldown>
</chart>
</panel>
<panel>
<table>
<title>Showing results from $from$ to $to$</title>
<search base="base">
<query>
| where _time>=$earliest$ AND _time<=$latest$
</query>
</search>
</table>
</panel>
</row>
</form>It's a run anywhere so you can see how the eval token statements in the drilldown use relative_time to calculate the number of days prior to the clicked date to set the from token.
You can see I have used the where clause to do the date filtering in the second search as I have used a base search, but in your case you could just do this in you original search
you_search earliest>=$earliest$ latest<=$latest$for the same effect.
Hope this helps.
- Mark as New
- Bookmark Message
- Subscribe to Message
- Mute Message
- Subscribe to RSS Feed
- Permalink
- Report Inappropriate Content
Wow.. nailed it. A little bit more involved than I thought it was but not too bad.
Thanks for the help! This works exactly as I was wanting it to!
Splunk AI Assistant for SPL vs. ChatGPT: Which One is Better?
Data Persistence in the OpenTelemetry Collector
Thanks for the Memories! Splunk University, .conf25, and our Community
