Turn on suggestions
Auto-suggest helps you quickly narrow down your search results by suggesting possible matches as you type.
Splunk Search
×
Are you a member of the Splunk Community?
Sign in or Register with your Splunk account to get your questions answered, access valuable resources and connect with experts!
Turn on suggestions
Auto-suggest helps you quickly narrow down your search results by suggesting possible matches as you type.
- Find Answers
- :
- Using Splunk
- :
- Splunk Search
- :
- Re: Dots/gaps in timechart when using sum(packets)...
Options
- Subscribe to RSS Feed
- Mark Topic as New
- Mark Topic as Read
- Float this Topic for Current User
- Bookmark Topic
- Subscribe to Topic
- Mute Topic
- Printer Friendly Page
- Mark as New
- Bookmark Message
- Subscribe to Message
- Mute Message
- Subscribe to RSS Feed
- Permalink
- Report Inappropriate Content
splunklearner12
Path Finder
06-26-2019
08:10 AM
When I use "(base search) | timechart sum(packets) by destination useother=f usenull=f", I get gaps in my timechart:
When I use a longer time frame of 1 day, I also get gaps:
In another timechart, I have the exact same base search and just "| timechart sum(packets)", and it has no gaps. I found that when I add "by destination" to this one, it also gets the gaps/dots.
As far as I can see on https://docs.splunk.com/Documentation/Splunk/7.3.0/SearchReference/Timechart timechart should convert null values to 0 by default...
Any ideas?
1 Solution
- Mark as New
- Bookmark Message
- Subscribe to Message
- Mute Message
- Subscribe to RSS Feed
- Permalink
- Report Inappropriate Content
adonio
Ultra Champion
06-26-2019
12:54 PM
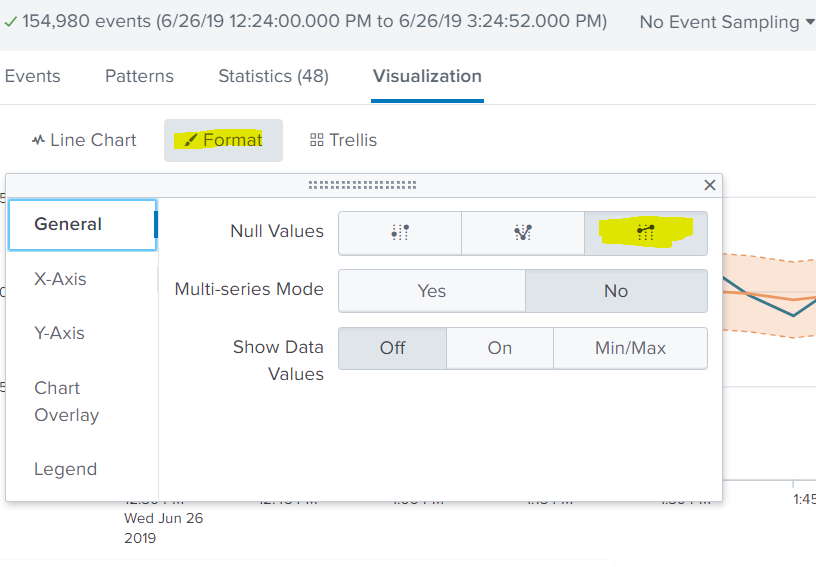
under visualization -> click format -> general tab -> click on connect in "Null Value" line
see attached screenshot
- Mark as New
- Bookmark Message
- Subscribe to Message
- Mute Message
- Subscribe to RSS Feed
- Permalink
- Report Inappropriate Content
adonio
Ultra Champion
06-26-2019
12:54 PM
- Mark as New
- Bookmark Message
- Subscribe to Message
- Mute Message
- Subscribe to RSS Feed
- Permalink
- Report Inappropriate Content
splunklearner12
Path Finder
06-27-2019
01:04 AM
Thank you for that simple solution. I found the second option called "Zero" looked nicer though!
Get Updates on the Splunk Community!
Splunk + ThousandEyes: Correlate frontend, app, and network data to troubleshoot ...
Are you tired of troubleshooting delays caused by siloed frontend, application, and network data? We've got a ...
Splunk Observability for AI
Don’t miss out on an exciting Tech Talk on Splunk Observability for AI!Discover how Splunk’s agentic AI ...
🔐 Trust at Every Hop: How mTLS in Splunk Enterprise 10.0 Makes Security Simpler
From Idea to Implementation: Why Splunk Built mTLS into Splunk Enterprise 10.0
mTLS wasn’t just a checkbox ...


