Are you a member of the Splunk Community?
- Find Answers
- :
- Using Splunk
- :
- Splunk Search
- :
- Display CPU Utilization per host per time using +A...
- Subscribe to RSS Feed
- Mark Topic as New
- Mark Topic as Read
- Float this Topic for Current User
- Bookmark Topic
- Subscribe to Topic
- Mute Topic
- Printer Friendly Page
- Mark as New
- Bookmark Message
- Subscribe to Message
- Mute Message
- Subscribe to RSS Feed
- Permalink
- Report Inappropriate Content
Display CPU Utilization per host per time using +Add Inputs from Edit Dashboard
Hi,
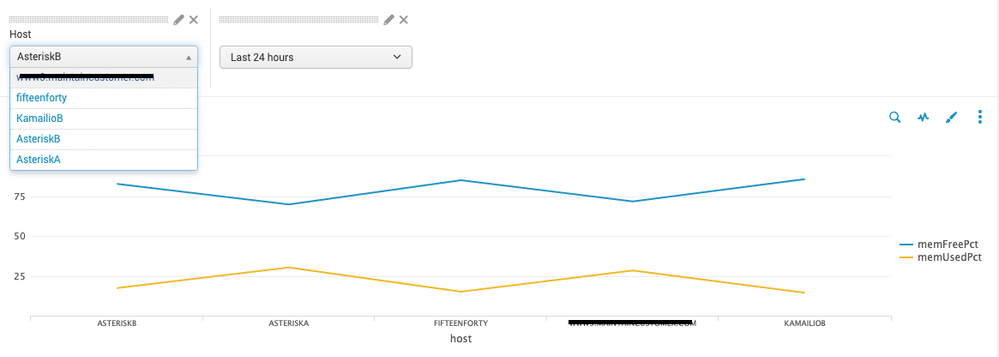
below is the timechart for my search to display CPU utilization of my forwarders and indexer
Using the host dropdown box, I would like to search for an individual host at a time to display its memFreePct and memUsedPct over a specific period of time (using Time dropdown box).
The search query is as follows:
source="vmstat"
            | dedup host
 | eval host=upper(host)
            | eval FreeGBs=FreeMBytes/1024, TotalGBs=TotalMBytes/1024, UsedGBs=UsedMBytes/1024
            | table host memFreePct memUsedPct
Is there a way I can edit this search query to be able to find timechart graph for only one host at a time using the dropdown box?
The search query in the Host dropdown box is as follows:
sourcetype=vmstat
| dedup host
|table host
Thanks in advance for the help.
Regards
- Mark as New
- Bookmark Message
- Subscribe to Message
- Mute Message
- Subscribe to RSS Feed
- Permalink
- Report Inappropriate Content
Hi @hishamjan
You will need to add a field to your search query to include the selected host from your dropdown.
For example, if the token from the dropdown was named "selected_host" then you would modify the search query for the panel to be:
source="vmstat" host=$selected_host$
            | dedup host
 | eval host=upper(host)
            | eval FreeGBs=FreeMBytes/1024, TotalGBs=TotalMBytes/1024, UsedGBs=UsedMBytes/1024
            | table host memFreePct memUsedPct
And you will need to modify the dropdown to assign a value or an "*" (for no selected hosts) to the token "selected_host". the Splunk documentation for Create and edit forms would be a great place to review those settings.
One more thing to consider, if you want to view the data over time, then you will probably want to modify the search query for your panel to be populated by a timechart instead of eval/table.
source="vmstat" host=$selected_host$
| eval host=upper(host)
| eval FreeGBs=FreeMBytes/1024, TotalGBs=TotalMBytes/1024, UsedGBs=UsedMBytes/1024
|timechart avg(memFreePct) as memFreePct, avg(memUsedPct) as memUsedPct by $selected_host$
Hope that helps.

