Join the Conversation
- Find Answers
- :
- Using Splunk
- :
- Splunk Search
- :
- Create a chart with multiple search and display ev...
- Subscribe to RSS Feed
- Mark Topic as New
- Mark Topic as Read
- Float this Topic for Current User
- Bookmark Topic
- Subscribe to Topic
- Mute Topic
- Printer Friendly Page
- Mark as New
- Bookmark Message
- Subscribe to Message
- Mute Message
- Subscribe to RSS Feed
- Permalink
- Report Inappropriate Content
Create a chart with multiple search and display events filtered by date
hi i'm new to splunk, need help to write a query to get records and create a chart based on that .
I am trying to combine 4 searches into one. all searches from same index and same source.
1. index=eventviewer sourcetype=applicationlog "#firsttry success"
2. index=eventviewer sourcetype=applicationlog "#firsttry failed"
3. index=eventviewer sourcetype=applicationlog "#secondtry success"
4. index=eventviewer sourcetype=applicationlog "#secondtry failed"
logic in the log is im trying to upload files into db with 2 tries. Records failed in #firsttry will pushed again with #secondtry.
firsttry faild count = #secondtry success count + #secondtry failed count.
i needs to display a time chart by date in x axis and all the search count in y axis .
Table should be like below
_time | TOTALCOUNT |SUCCESS#1 |FAILED#1 |SUCCESS#2 |FAILED#2
2018-03-29 | 100 | 80 | 20 | 15 | 5
2018-03-30 | 60 |50 |10 |7 | 3
wanted to create chart to show all the 5 counts should display next to one another, when i click any one of the column in the chart it should display the correct events filtered by date.
please help on this
thanks in advance
- Mark as New
- Bookmark Message
- Subscribe to Message
- Mute Message
- Subscribe to RSS Feed
- Permalink
- Report Inappropriate Content
I would use a stacked column chart like this example below:
| gentimes start=3/29/2018 increment=24h end=04/12/2018
| eval startunix=strptime(starthuman,"%a %B %d %H:%M:%S.%N %Y")
| eval c_time=strftime(starttime,"%Y-%m-%d")
| eval TOTALCOUNT = starttime%100000/100
| eval SUCCESSONE = floor((random() % TOTALCOUNT)/2 + 1)
| eval FAILEDONE = TOTALCOUNT - SUCCESSONE
| eval SUCCESSTWO =  floor((random() % FAILEDONE)/2 + 1)
| eval FAILEDTWO =  FAILEDONE - SUCCESSTWO
| table c_time, SUCCESSONE, FAILEDONE, SUCCESSTWO,FAILEDTWO][1]
The total will be the height of the stacked column for a particular date. Is this what you are looking for?

- Mark as New
- Bookmark Message
- Subscribe to Message
- Mute Message
- Subscribe to RSS Feed
- Permalink
- Report Inappropriate Content
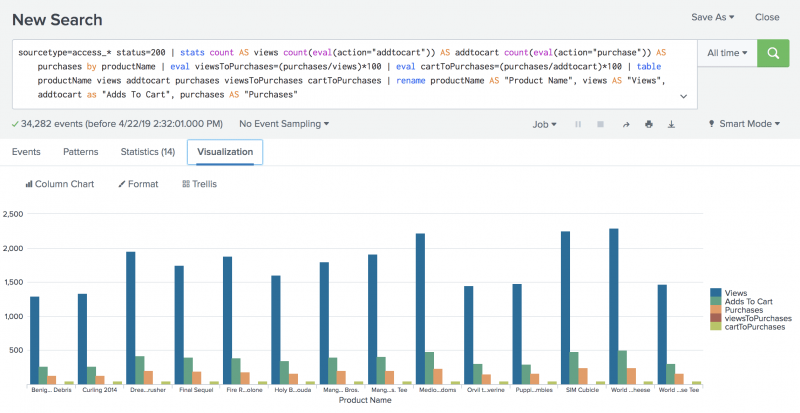
hi i need help to get count of each search, i dont know how to use multiple searches. then i needs to display an overlay chart like below
- Mark as New
- Bookmark Message
- Subscribe to Message
- Mute Message
- Subscribe to RSS Feed
- Permalink
- Report Inappropriate Content
In this case, (assume you have all the counts already) you can set
<option name="charting.chart.stackMode">default</option>
Simple XML for an example panel is listed below:
      <title>Not Stacked</title>
      <chart>
        <search>
          <query>| gentimes start=3/29/2018 increment=24h end=04/29/2018
| eval startunix=strptime(starthuman,"%a %B %d %H:%M:%S.%N %Y")
| eval c_time=strftime(starttime,"%Y-%m-%d")
| eval TOTALCOUNT = starttime%100000/100
| eval SUCCESSONE = floor((random() % TOTALCOUNT)/2 + 1)
| eval FAILEDONE = TOTALCOUNT - SUCCESSONE
| eval SUCCESSTWO =  floor((random() % FAILEDONE)/2 + 1)
| eval FAILEDTWO =  FAILEDONE - SUCCESSTWO
| table c_time, TOTALCOUNT, SUCCESSONE, FAILEDONE, SUCCESSTWO,FAILEDTWO</query>
          <earliest>-24h@h</earliest>
          <latest>now</latest>
          <sampleRatio>1</sampleRatio>
        </search>
        <option name="charting.axisLabelsX.majorLabelStyle.overflowMode">ellipsisNone</option>
        <option name="charting.axisLabelsX.majorLabelStyle.rotation">0</option>
        <option name="charting.axisTitleX.visibility">visible</option>
        <option name="charting.axisTitleY.visibility">visible</option>
        <option name="charting.axisTitleY2.visibility">visible</option>
        <option name="charting.axisX.abbreviation">none</option>
        <option name="charting.axisX.scale">linear</option>
        <option name="charting.axisY.abbreviation">none</option>
        <option name="charting.axisY.scale">linear</option>
        <option name="charting.axisY2.abbreviation">none</option>
        <option name="charting.axisY2.enabled">0</option>
        <option name="charting.axisY2.scale">inherit</option>
        <option name="charting.chart">column</option>
        <option name="charting.chart.bubbleMaximumSize">50</option>
        <option name="charting.chart.bubbleMinimumSize">10</option>
        <option name="charting.chart.bubbleSizeBy">area</option>
        <option name="charting.chart.nullValueMode">gaps</option>
        <option name="charting.chart.showDataLabels">none</option>
        <option name="charting.chart.sliceCollapsingThreshold">0.01</option>
        <option name="charting.chart.stackMode">default</option>
        <option name="charting.chart.style">shiny</option>
        <option name="charting.drilldown">none</option>
        <option name="charting.layout.splitSeries">0</option>
        <option name="charting.layout.splitSeries.allowIndependentYRanges">0</option>
        <option name="charting.legend.labelStyle.overflowMode">ellipsisMiddle</option>
        <option name="charting.legend.mode">standard</option>
        <option name="charting.legend.placement">right</option>
        <option name="charting.lineWidth">2</option>
        <option name="trellis.enabled">0</option>
        <option name="trellis.scales.shared">1</option>
        <option name="trellis.size">medium</option>
      </chart>
    </panel>
Join the Splunk Community Slack to learn, troubleshoot, and make connections with fellow Splunk practitioners in real time!
Join Splunk User Groups to connect and learn in-person by region or remotely by topic or industry.
[Puzzles] Solve, Learn, Repeat: Matching cron expressions
Design, Compete, Win: Submit Your Best Splunk Dashboards for a .conf26 Pass
May 2026 Splunk Expert Sessions: Security & Observability
