- Find Answers
- :
- Using Splunk
- :
- Splunk Search
- :
- Changing the order of displayed single field value...
- Subscribe to RSS Feed
- Mark Topic as New
- Mark Topic as Read
- Float this Topic for Current User
- Bookmark Topic
- Subscribe to Topic
- Mute Topic
- Printer Friendly Page
- Mark as New
- Bookmark Message
- Subscribe to Message
- Mute Message
- Subscribe to RSS Feed
- Permalink
- Report Inappropriate Content
Hello, fellow Splunkers.
I am currently trying to create a stacked timechart column using a simple search query: timechart count by type limit=0
Since Splunk uses lexicographical ordering by default, I ended up getting an undesired end result.
In this particular situation, I have several types(values of the single field) that I would like to display next to each other in the column chart and to do that I have tried assigning a numerical values by using eval/case commands and then sorting the values like this:
timechart count by type limit=0 | eval sort_field=case(type="type1",1, type="type2",2, type="type3",3, type="type4",4) | sort sort_field
This approach had no effect whatsoever and no values were changed/re-ordered. As far as I can tell, not even the sort_field was created.I think there is a specific behavior when using this method with timecharts/charts, but I have not yet figured out a working solution. I managed to debug it a little bit further by trying to re-construct the search bit-by-bit and when I removed the timechart:
... | eval sort_field=case(type="type1",1, type="type2",2, type="type3",3, type="type4",4) | sort sort_field
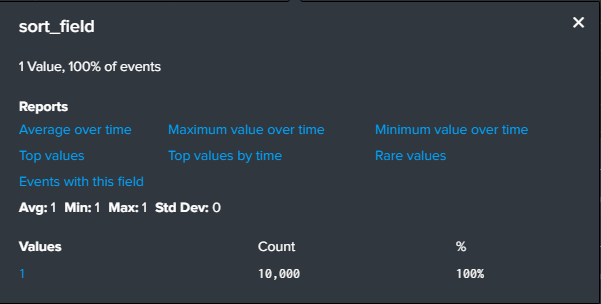
I could see that the field(sort_field) only had 1 value(the first order value):
I do believe that there is a major syntax error on my part or something else entirely that I don't fundamentally understand yet.
To sum it up, I am trying to create a column chart showing the count of events based on their type over a period of time. The problem is that the types(chart legend values) are being alphabetically ordered and I would like them to appear in a custom order on the chart.
Perhaps there is someone with more charting experience willing to lend a helping hand? It would be most appreciated.
- Mark as New
- Bookmark Message
- Subscribe to Message
- Mute Message
- Subscribe to RSS Feed
- Permalink
- Report Inappropriate Content
| makeresults count=2
| streamstats count
| eval _time=if((count == 2),relative_time('_time',"-7d@d"),relative_time('_time',"@d"))
| makecontinuous span=1h
| eval type="type".(random() % 4 +1)
| table _time type
| timechart limit=0 count by type
Hi, @sendijsd
please try this query. Result is below.
_time,type1,type2,type3,type4
2019/11/30,4,7,8,5
2019/12/01,9,3,8,4
....
This is the current order.
Use fields or table to change it.
| makeresults count=2
| streamstats count
| eval _time=if((count == 2),relative_time('_time',"-7d@d"),relative_time('_time',"@d"))
| makecontinuous span=1h
| eval type="type".(random() % 4 +1)
| table _time type
| timechart limit=0 count by type
| table _time type4,type3,type2,type1
I hope this can solve your problem.
- Mark as New
- Bookmark Message
- Subscribe to Message
- Mute Message
- Subscribe to RSS Feed
- Permalink
- Report Inappropriate Content
Hey, @to4kawa
This was exactly what I was looking for. I am accepting your answer, thank you very much!

