- Find Answers
- :
- Using Splunk
- :
- Splunk Search
- :
- Change color of Column Chart bars based on average...
- Subscribe to RSS Feed
- Mark Topic as New
- Mark Topic as Read
- Float this Topic for Current User
- Bookmark Topic
- Subscribe to Topic
- Mute Topic
- Printer Friendly Page
- Mark as New
- Bookmark Message
- Subscribe to Message
- Mute Message
- Subscribe to RSS Feed
- Permalink
- Report Inappropriate Content
Dear Splunk Community,
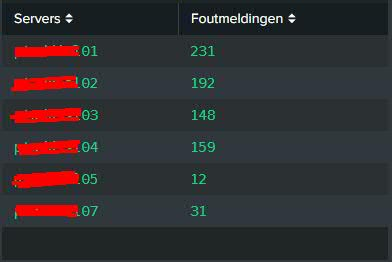
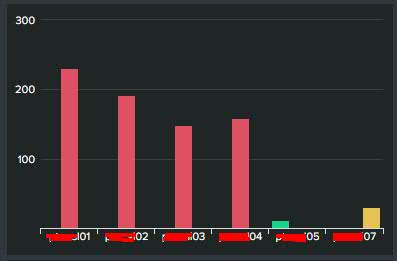
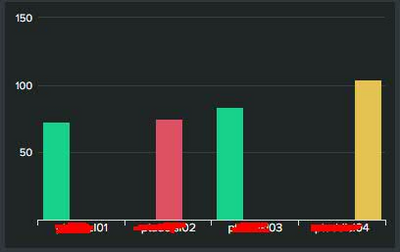
I have the following statistics table and corresponding column chart that show the amount of errors per server:
And
Right now I am changing the colors on the column chart based on a static value like so:
index="myIndex"
host="myHostOne*" OR host="myHostTwo*"
source="mySource"
ERROR
NOT WARN
CTJT*
| table host, errors
| eval errors = host | stats count by host
| eval redCount = if(count>50,count,0)
| eval yellowCount = if(count<=50 AND count>25,count,0)
| eval greenCount = if(count <=25,count,0)
| fields - count
| dedup host
| rex field=host mode=sed "s/\..*$//"
| sort host asc
| rename host AS "Servers"
| rename count AS "Foutmeldingen"
The above uses a time range of "last 24 hours". I would like to change the colors of the bars (green, yellow, red) when a certain percentage of errors has been reached, based on the average of last week.
To summarize, I would like to:
- Somehow get the average amount of errors per server per day from the last 7 days
- Then specify a percentage for each color (e.g if the amount of errors today are 25% more than the average of last week, make the bar red)
I have no idea on how to do this, can anyone help? Thanks in advance.
- Mark as New
- Bookmark Message
- Subscribe to Message
- Mute Message
- Subscribe to RSS Feed
- Permalink
- Report Inappropriate Content
index="myIndex" earliest=-7d@d latest=now
host="myHostOne*" OR host="myHostTwo*"
source="mySource"
ERROR
NOT WARN
CTJT*
| bin _time span=1d
| stats count by host _time
| eventstats avg(count) as average by host
| where _time=relative_time(now(),"@d")
| eval red=if(count>average*1.25,count,0)
| eval yellow=if(count<=average*1.25 AND count>average,count,0)
| eval green=if(count<=average,count,0)
| fields - _time count average
| rex field=host mode=sed "s/\..*$//"
| sort host asc
| rename host AS "Servers"- Mark as New
- Bookmark Message
- Subscribe to Message
- Mute Message
- Subscribe to RSS Feed
- Permalink
- Report Inappropriate Content
index="myIndex" earliest=-7d@d latest=@d
host="myHostOne*" OR host="myHostTwo*"
source="mySource"
ERROR
NOT WARN
CTJT*
| bin _time span=1d
| stats count by host _time
| eventstats avg(count) as average by host
| where _time=relative_time(now(),"-1d@d")
| eval red=if(count>average*1.25,count,0)
| eval yellow=if(count<=average*1.25 AND count>average,count,0)
| eval green=if(count<=average,count,0)
| fields - _time count average
| rex field=host mode=sed "s/\..*$//"
| sort host asc
| rename host AS "Servers"- Mark as New
- Bookmark Message
- Subscribe to Message
- Mute Message
- Subscribe to RSS Feed
- Permalink
- Report Inappropriate Content
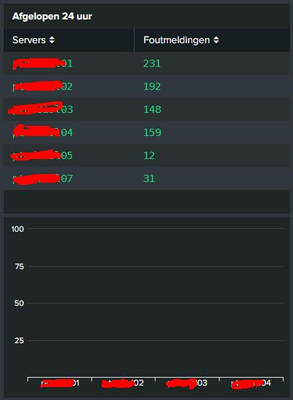
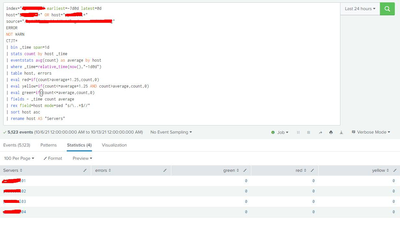
Unfortunately I get 0 results in the table as the counts are all 0, I do however get events:
Any clue?
- Mark as New
- Bookmark Message
- Subscribe to Message
- Mute Message
- Subscribe to RSS Feed
- Permalink
- Report Inappropriate Content
EDIT: I missed something, looks like this now, seems something with the date is still a bit off:
- Mark as New
- Bookmark Message
- Subscribe to Message
- Mute Message
- Subscribe to RSS Feed
- Permalink
- Report Inappropriate Content
You had
| table host, errorswhich you didn't need.
The dates are based on yesterday and the last 7 days - if you want today (so far), change the latest to now() and the where clause to include data from today instead of yesterday
- Mark as New
- Bookmark Message
- Subscribe to Message
- Mute Message
- Subscribe to RSS Feed
- Permalink
- Report Inappropriate Content
How do I correctly adjust the where clause? I want the last 24 hours (to match the statistics table) but using -24h or -24h@s gives me no results found. message.
Like so:
| where _time=relative_time(now(),"-24h@s")
| where _time=relative_time(now(),"-24h")
- Mark as New
- Bookmark Message
- Subscribe to Message
- Mute Message
- Subscribe to RSS Feed
- Permalink
- Report Inappropriate Content
The issue you have is the mismatch between last 24 hours and last 7 days - last 24 hours will be snapped to the hour whereas last 7 days will be snapped to the day. This makes the query more complicated, so please can you specify exactly which time periods you want to compare, including the snapping you want for each period
- Mark as New
- Bookmark Message
- Subscribe to Message
- Mute Message
- Subscribe to RSS Feed
- Permalink
- Report Inappropriate Content
Can we solve this issue if we change both the table and the chart to today so both times are days rather then a mismatch between hours and days? That would work for me. Not sure if now() works like that and if it is possible. Thoughts?
- Mark as New
- Bookmark Message
- Subscribe to Message
- Mute Message
- Subscribe to RSS Feed
- Permalink
- Report Inappropriate Content
index="myIndex" earliest=-7d@d latest=now
host="myHostOne*" OR host="myHostTwo*"
source="mySource"
ERROR
NOT WARN
CTJT*
| bin _time span=1d
| stats count by host _time
| eventstats avg(count) as average by host
| where _time=relative_time(now(),"@d")
| eval red=if(count>average*1.25,count,0)
| eval yellow=if(count<=average*1.25 AND count>average,count,0)
| eval green=if(count<=average,count,0)
| fields - _time count average
| rex field=host mode=sed "s/\..*$//"
| sort host asc
| rename host AS "Servers"- Mark as New
- Bookmark Message
- Subscribe to Message
- Mute Message
- Subscribe to RSS Feed
- Permalink
- Report Inappropriate Content
Not sure if I can ask this in this topic as a solution has been marked but, with the exact same query the following works:
For today:
earliest=-7d@d latest=now
| where _time=relative_time(now(),"@d")
For yesterday:
earliest=-7d@d latest=now
| where _time=relative_time(now(),"-1d@d")
Even this works:
earliest=-7d@d latest=now
| where _time=relative_time(now(),"-2d@d")
But this does not work:
earliest=-1mon@mon latest=now
| where _time=relative_time(now(),"-7d@d")
The last query only a handfull of results (even less then todays). Any idea why? I am expecting hundreds/thousands of results.
- Mark as New
- Bookmark Message
- Subscribe to Message
- Mute Message
- Subscribe to RSS Feed
- Permalink
- Report Inappropriate Content
You may have hit some limit on the number of events or amount of memory used. Do you get any errors / warnings when the job is executed?
- Mark as New
- Bookmark Message
- Subscribe to Message
- Mute Message
- Subscribe to RSS Feed
- Permalink
- Report Inappropriate Content
I got no errors. I tried changing the query like so:
earliest=-2d@d latest=now
| where _time=relative_time(now(),"-2d@d")
It results 2959 events and the following statistics:
Servers green red
| 01 | 0 | 388 |
| 02 | 110 | 0 |
| 03 | 0 | 1243 |
| 04 | 0 | 251 |
| 05 | 177 | 0 |
| 06 | 189 | 0 |
| 07 | 193 | 0 |
When changing to 3 days:
earliest=-3d@d latest=now
| where _time=relative_time(now(),"-3d@d")
It results 3024 events.
But this is the result in statistics:
Servers green red
| 01 | 11 | 0 |
| 02 | 26 | 0 |
| 03 | 13 | 0 |
| 04 | 15 | 0 |
- Mark as New
- Bookmark Message
- Subscribe to Message
- Mute Message
- Subscribe to RSS Feed
- Permalink
- Report Inappropriate Content
That looks correct
There were 2959 events between the beginning of the day before yesterday and now, and 3024 between the day before that and now 3024 - 2959 = 65 which is the number of events on that previous day, 11+26+13+15 = 65
- Mark as New
- Bookmark Message
- Subscribe to Message
- Mute Message
- Subscribe to RSS Feed
- Permalink
- Report Inappropriate Content
Aaah okay I was under the impression that when using relative_time you fetch everything in between start date and now. I was expecting all the errors counted from in between now and 3 days ago. How would I edit this query to get all errors counted from the past 7 days?
- Mark as New
- Bookmark Message
- Subscribe to Message
- Mute Message
- Subscribe to RSS Feed
- Permalink
- Report Inappropriate Content
relative_time will give you an epoch date time value. You can compare _time (from the events in the pipeline) to that point in time and keep everything equal to or after that time.
| where _time>=relative_time(now(),"-7d@d")- Mark as New
- Bookmark Message
- Subscribe to Message
- Mute Message
- Subscribe to RSS Feed
- Permalink
- Report Inappropriate Content
Much obliged, got it all working now.
- Mark as New
- Bookmark Message
- Subscribe to Message
- Mute Message
- Subscribe to RSS Feed
- Permalink
- Report Inappropriate Content
Thanks a lot 🙂
