- Find Answers
- :
- Using Splunk
- :
- Splunk Search
- :
- Case open count and trend history
- Subscribe to RSS Feed
- Mark Topic as New
- Mark Topic as Read
- Float this Topic for Current User
- Bookmark Topic
- Subscribe to Topic
- Mute Topic
- Printer Friendly Page
- Mark as New
- Bookmark Message
- Subscribe to Message
- Mute Message
- Subscribe to RSS Feed
- Permalink
- Report Inappropriate Content
We're using a REST API to connect to a case / monitoring system and retrieve any data newer than the last run. This data is a per-case JSON construct that contains all current information about the case such as its ID, status, timestamps, associated alert counts, etc. So, Splunk events are written when:
- A new case opened.
- An existing case's status is changed.
- An existing case's assigned user is changed.
- etc
I'm having trouble with one dashboard panel in particular - a single value to show the number of alerts that are currently open and a sparkline for trends / history. Because of the way that the data is structured and transferred, I've only been able to do one or the other.
The following search works pretty well when new cases are opened (because the number of returned events increases between each search) but it "forgets" cases when they're closed (because the search filter causes the number of returned events to decrease).
index="<client>" case_id | dedup 1 case_id sortby -_time | search (status=new OR status=in_progress) | append [| makeresults | eval alert_count_total = 0] | reverse | timechart sum(alert_count) as alert_count_total | addcoltotals | filldown alert_count_total
I guess it needs some kind of "if the cases are open then sum the alerts but if not then set the alert sum to 0" logic so I created the following search which seems to get what I want but only separately - the Single View visualisation seems to be incompatible:
index="<client>" case_id | dedup 1 case_id sortby -_time | eval openorclosed=if(status="new" OR status="in_progress", "Open", "Closed") | eval alert_count_open=case(openorclosed="Open", alert_count, openorclosed="Closed", 0) | stats sparkline(sum(alert_count)), sum(alert_count_open)
Also, I've found SPL2's branch command which seems very promising but I don't know how to use datasets, etc which seem to be required.
Thanks in advance.
- Mark as New
- Bookmark Message
- Subscribe to Message
- Mute Message
- Subscribe to RSS Feed
- Permalink
- Report Inappropriate Content
I discovered a few more edge cases which my previous search query couldn't handle:
- If a case was created and its status was changed from new to in_progress before the next REST API poll then that would be the first event in Splunk and, because of its status, it would be filtered out and wouldn't be counted.
- If a case's creation event was missed, then a user being assigned to the case would be seen as the first event and, because the the modification _time was being used, it would appear in the wrong place on the sparkline (history / trend graph).
- If a case was closed then its status was changed to a different resolution type then the closure would be double counted.
I resolved these with the following new search query:
index="<client>"
| dedup case_id, status sortby -_time
| reverse
| eval openClosed = case(match(status, "new|in_progress"), "Open", match(status, "resolved_other|resolved_auto"), "Closed")
| streamstats current=f last(status) as lastStatus by case_id
| eval firstEvent = if(openClosed == "Open" AND isnull(lastStatus), "True", "False")
| eval lastEvent = if(openClosed == "Closed", "True", "False")
| where firstEvent == "True" OR lastEvent  == "True"
| dedup case_id, openClosed sortby -_time
| append [| makeresults | eval _time = 0, alert_count = 10000, openClosed = "Closed"]
| eval _time = if(status == "new", strptime(creation_time, "%Y/%m/%d %H:%M:%S"), _time)
| sort +_time
| eval alert_count_change = case(openClosed == "Open", "+" . alert_count, openClosed == "Closed", "-" . alert_count)
| streamstats sum(alert_count_change) as alert_count_open_total
| streamstats min(alert_count_open_total) as alert_count_open_min
| eval alert_count_open_total_nonegatives = case(alert_count_open_total == alert_count_open_min, 0, alert_count_open_total < 0 AND alert_count_open_total > alert_count_open_min, alert_count_open_total - alert_count_open_min, alert_count_open_total > 0 AND alert_count_open_total < alert_count_change, alert_count_change, 1=1, alert_count_open_total)
| table _time, alert_count_open_total_nonegatives, alert_count_open_total, alert_count_change, alert_count, case_id, status, lastStatus, openClosed, firstEvent, lastEvent
Final explanation (hopefully):
- | dedup case_id, status sortby -_time
This gets the latest event per status for each case. This is useful in some cases such as:- An existing case is updated with an increased alert count but the status doesn't change from new.
- A case's assigned user is changed but the status doesn't change from in_progress.
- | reverse
By default, the events are ordered by newest first but streamstats is order-sensitive so we reverse to get the oldest events first otherwise our latest / current value would actually be the oldest. - | eval openClosed = case(match(status, "new|in_progress"), "Open", match(status, "resolved_|etc"), "Closed")
As there are various types of open and closed statuses, this consolidates all of them into simple values for use in upcoming evaluations. - | streamstats current=f last(status) as lastStatus by case_id
This looks at the previous event and stores its status which we'll need for determining whether an event is a "middle" one (not the case creation or closure). - | eval firstEvent = if(openClosed == "Open" AND isnull(lastStatus), "True", "False")
| eval lastEvent = if(openClosed == "Closed", "True", "False")
| where firstEvent == "True" OR lastEvent == "True"
This filters out any of the aforementioned "middle" events, leaving us with the case creation and closure events of which we'll need their alert counts for the sparkline sum. - | dedup case_id, openClosed sortby -_time
Sometimes there are multiple closure events for the same case if, for example, a resolved status was changed to a different type. For those scenarios, this gets the last instance of Closed = the last closure event. - | append [| makeresults | eval _time = 0, alert_count = 10000, openClosed = "Closed"]
A later case evaluation that prevents a count from going negative has a problem where it can't handle a value of 0 so, to resolve that, we need to keep the value away from 0 by creating a negative baseline. To do that, we need to prefix a fake event with (1) an extreme alert count which a later evaluation will convert to negative due to it being closed and (2) a timestamp which is guaranteed to be the first / earliest event. - | eval _time = if(status == "new", strptime(creation_time, "%Y/%m/%d %H:%M:%S"), _time)
In our scenario, each event contains two time fields: creation_time and modification_time, _time being parsed from the latter. So, if the status is new then we need to change the value of _time to a Unix epoch version of creation_time which resolves newly-discovered edge case #2. - | sort +_time
Earlier, we used reverse which put all of the events in the right order but we've since done a few different things which have messed up the timeline so we need to order from oldest to newest events again to ensure that the sparkline is correct. - | eval alert_count_change = case(openClosed == "Open", "+" . alert_count, openClosed == "Closed", "-" . alert_count)
Open and closed cases have the exact same number of alerts because it's only the status that changes but we want the closed cases' alert counts to be subtracted from the open figure and vice versa. Fortunately, a plus-minus equals a minus (something I haven't even thought of since high school which I'm now thankful for) so all we have to do is prefix a minus symbol and the sum command takes care of the rest.
Prefixing the plus symbol isn't necessary but it keeps things easy to read and allows you to search for explicitly positive values.
Also, even though it looks like a string concatenation, the result is actually a number type, as verified by testing with typeof(). - | streamstats sum(alert_count_change) as alert_count_open_total
This sums the (positive and negative) values of the column / fields alert_count_change line by line. - | streamstats min(alert_count_open_total) as alert_count_open_min
| eval alert_count_open_total_nonegatives = case(alert_count_open_total == alert_count_open_min, 0, alert_count_open_total < 0 AND alert_count_open_total > alert_count_open_min, alert_count_open_total - alert_count_open_min, alert_count_open_total > 0 AND alert_count_open_total < alert_count_change, alert_count_change, 1=1, alert_count_open_total)
Sometimes we don't have the events for case creations because they were already closed when the case data was retrieved which results in negative numbers but we can't have negative cases open so, as mentioned earlier, this prevents the value from going negative. Again, big thank you to @ALXWBR for asking this question and to @DavidHourani for answering it at https://community.splunk.com/t5/Splunk-Search/Streamstats-sum-that-doesn-t-go-below-zero/td-p/454371 - | table _time, alert_count_open_total_nonegatives, alert_count_open_total, alert_count_change, alert_count, case_id, status, lastStatus, openClosed, firstEvent, lastEvent
A table is required for statistics, the first value from the left is used for the X axis so we use _time, and the second value is used for the Y axis so we use alert_count_open_total_nonegatives. Everything else is just there in case we need to diagnose a problem or export the data.
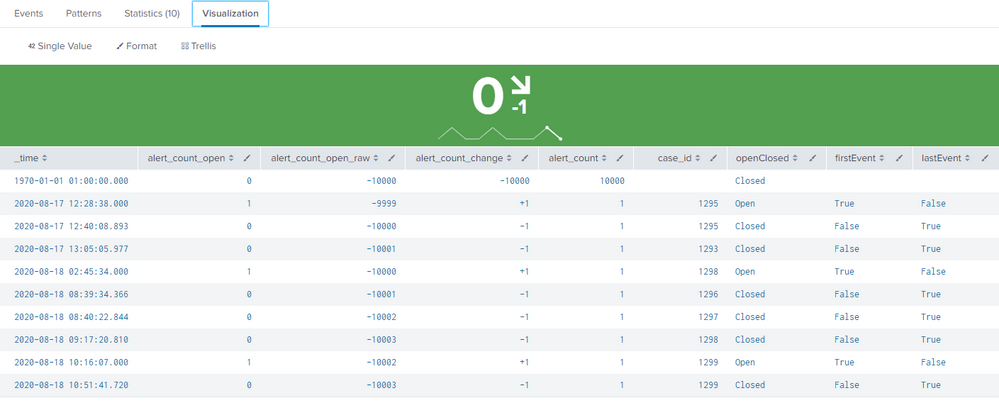
If per-severity trends are desired then simply append severity_count_field > 0 to the first search term. Just be aware that this radically changes the sparklines as you can see below:
- Mark as New
- Bookmark Message
- Subscribe to Message
- Mute Message
- Subscribe to RSS Feed
- Permalink
- Report Inappropriate Content
I seem to have achieved this with the following search:
index="<client>" case_id | dedup case_id, status | where status!="in_progress" | reverse | eval openorclosed=if(status="new", "Open", "Closed") | eval alert_count_change=case(openorclosed="Open", "+" . alert_count, openorclosed="Closed", "-" . alert_count) | streamstats sum(alert_count_change) as alert_count_open_total | streamstats min(alert_count_open_total) as alert_count_open_min | eval alert_count_open_total_nonegatives=case(alert_count_open_total==alert_count_open_min, 0, alert_count_open_total<0 AND alert_count_open_total>alert_count_open_min, alert_count_open_total-alert_count_open_min, alert_count_open_total>0 AND alert_count_open_total< alert_count_change, alert_count_change, 1=1 , alert_count_open_total) | table _time, alert_count_open_total_nonegatives
Explanation:
- 'dedup case_id, status | where status!="in_progress"':
This gets the first event and last event for each case. These figures are needed for the sparkline - case creation means alerts are opened and case closure means alerts have been closed / handled. - 'reverse':
By default, the newest events are returned but, due to streamstats being order-sensitive, that would cause the sparkline to be the wrong way around so we reverse to get the oldest events first. - 'eval openorclosed=if(status="new", "Open", "Closed")':
This isn't strictly needed but it keeps things easy for the next step. - 'eval alert_count_change=case(openorclosed="Open", "+" . alert_count, openorclosed="Closed", "-" . alert_count)':
Open and closed cases have the same number of alerts but we want the closed cases' alerts to be subtracted from the open figure. Fortunately, a plus-minus equals a minus so all we have to do is pre-fix a minus and the sum command takes care of the rest. Also, adding the plus isn't strictly needed but, again, it keeps things easy. - 'streamstats sum(alert_count_change) as alert_count_open_total':
This adds the values of the column / fields "alert_count_change" line by line. - 'streamstats min(alert_count_open_total) as alert_count_open_min | eval alert_count_open_total_nonegatives=case(alert_count_open_total==alert_count_open_min, 0, alert_count_open_total<0 AND alert_count_open_total>alert_count_open_min, alert_count_open_total-alert_count_open_min, alert_count_open_total>0 AND alert_count_open_total< alert_count_change, alert_count_change, 1=1 , alert_count_open_total)':
Sometimes we don't have the events for case creations, only case closures. This can result in negative numbers but we can't have negative cases open so this prevents the value from going negative. Big thank you to ALXWBR for asking this question and to DavidHourani for answering it (see https://community.splunk.com/t5/Splunk-Search/Streamstats-sum-that-doesn-t-go-below-zero/td-p/454371) - 'table _time, alert_count_open_total_nonegatives':
A table is required for statistics and _time is required for the sparkline.
- Mark as New
- Bookmark Message
- Subscribe to Message
- Mute Message
- Subscribe to RSS Feed
- Permalink
- Report Inappropriate Content
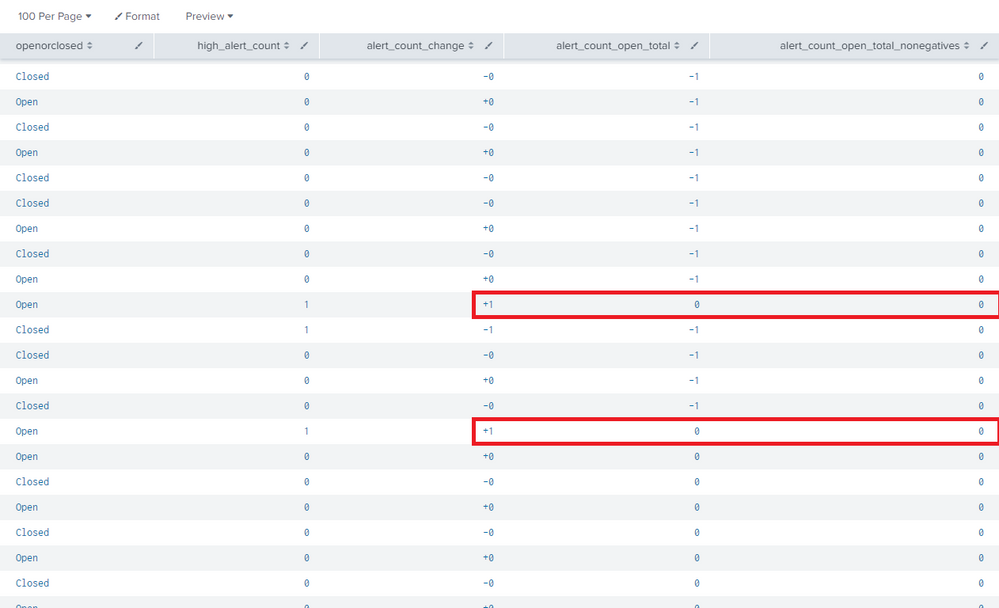
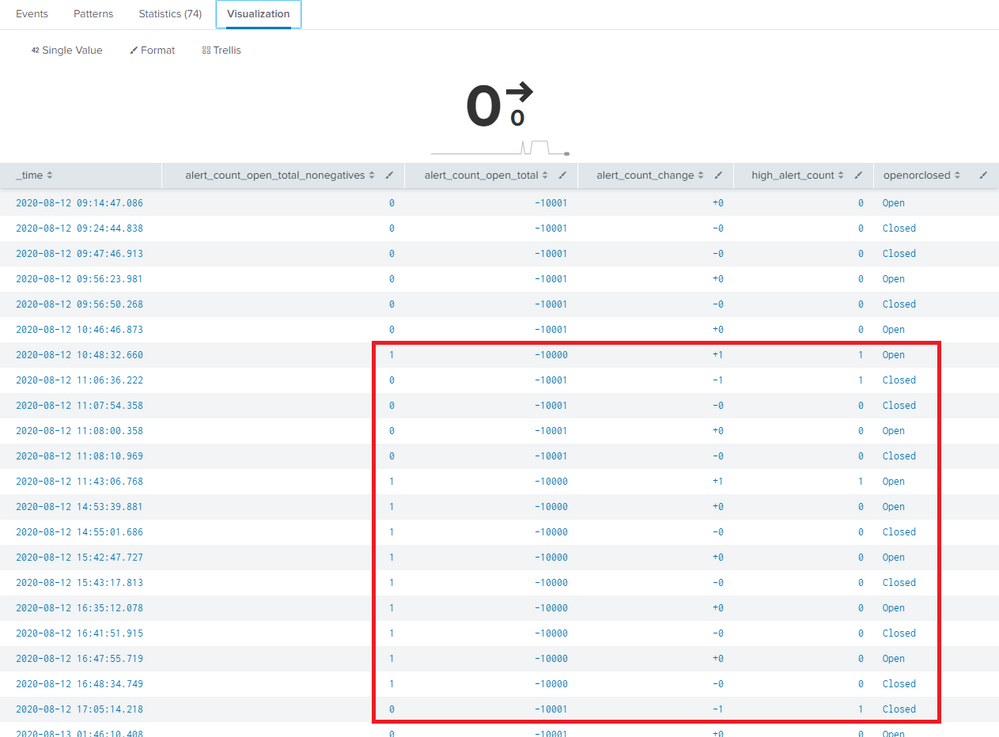
I noticed a problem with my search query: it couldn't handle changes + / - 1. This can be seen below:
This was fairly easily resolved by adding case 'alert_count_change=="+1" AND alert_count_open_total=="0", 1' but that only resolved the problem for one line. This can be seen below:
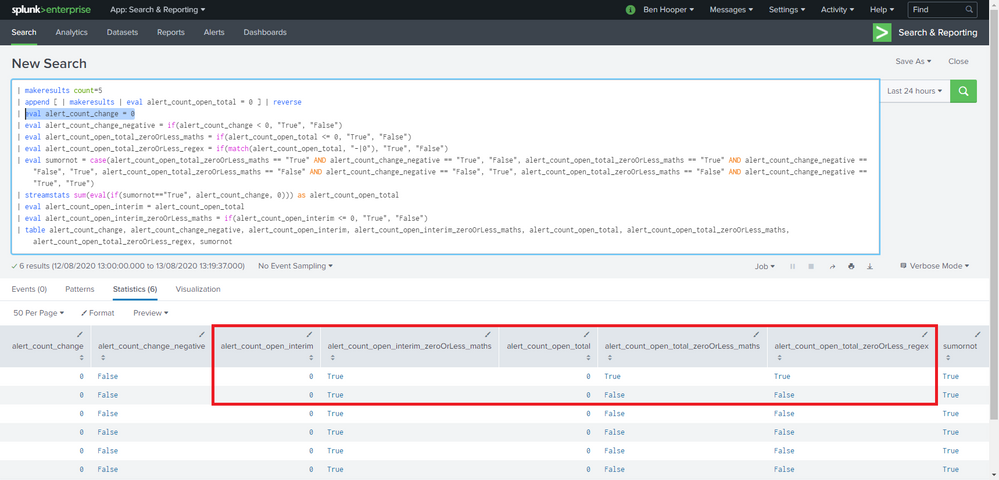
I'm now trying to write a search query that uses a conditional sum so that the result can't even go negative in the first place but I haven't been able to even evaluate streamstats' output because as soon as it sets the variable then, somehow, it seems to becomes practically immune to maths- and regex-based checks. I've included a recreatable example below:
| makeresults count=5
| append [ | makeresults | eval alert_count_open_total = 0 ] | reverse
| eval alert_count_change = 5
| eval alert_count_change_negative = if(alert_count_change < 0, "True", "False")
| eval alert_count_open_total_zeroOrLess_maths = if(alert_count_open_total <= 0, "True", "False")
| eval alert_count_open_total_zeroOrLess_regex = if(match(alert_count_open_total, "-|0"), "True", "False")
| eval sumornot = case(alert_count_open_total_zeroOrLess_maths == "True" AND alert_count_change_negative == "True", "False", alert_count_open_total_zeroOrLess_maths == "True" AND alert_count_change_negative == "False", "True", alert_count_open_total_zeroOrLess_maths == "False" AND alert_count_change_negative == "False", "True", alert_count_open_total_zeroOrLess_maths == "False" AND alert_count_change_negative == "True", "True")
| streamstats sum(eval(if(sumornot=="True", alert_count_change, 0))) as alert_count_open_total
| eval alert_count_open_interim = alert_count_open_total
| eval alert_count_open_interim_zeroOrLess_maths = if(alert_count_open_interim <= 0, "True", "False")
| table alert_count_change, alert_count_change_negative, alert_count_open_interim, alert_count_open_interim_zeroOrLess_maths, alert_count_open_total, alert_count_open_total_zeroOrLess_maths, alert_count_open_total_zeroOrLess_regex, sumornot
- Mark as New
- Bookmark Message
- Subscribe to Message
- Mute Message
- Subscribe to RSS Feed
- Permalink
- Report Inappropriate Content
I went back through my post and noticed that, with my original "solution" search query, the problem would only occur when "alert_count_open_total" was 0 so I thought I'd just try prefixing a fake event with an extremely negative alert count to create a non-0-based baseline which actually seems to have fully resolved the problem.
My search query is now as follows:
index="<client>" case_id
| dedup case_id, status
| where status != "in_progress"
| append [| makeresults | eval high_alert_count = 10000]
| reverse
| eval openorclosed = if(status == "new", "Open", "Closed")
| eval alert_count_change = case(openorclosed == "Open", "+" . high_alert_count , openorclosed == "Closed", "-" . high_alert_count )
| eval alert_count_open_total = if(alert_count_open_total < 0, 0, alert_count_open_total)
| streamstats sum(alert_count_change) as alert_count_open_total
| streamstats min(alert_count_open_total) as alert_count_open_min
| eval alert_count_open_total_nonegatives = case(alert_count_open_total == alert_count_open_min, 0, alert_count_open_total < 0 AND alert_count_open_total > alert_count_open_min, alert_count_open_total - alert_count_open_min, alert_count_open_total > 0 AND alert_count_open_total <
 alert_count_change, alert_count_change, 1=1, alert_count_open_total)
| table _time, alert_count_open_total_nonegatives, alert_count_open_total, alert_count_change, high_alert_count, openorclosed
- Mark as New
- Bookmark Message
- Subscribe to Message
- Mute Message
- Subscribe to RSS Feed
- Permalink
- Report Inappropriate Content
I discovered a few more edge cases which my previous search query couldn't handle:
- If a case was created and its status was changed from new to in_progress before the next REST API poll then that would be the first event in Splunk and, because of its status, it would be filtered out and wouldn't be counted.
- If a case's creation event was missed, then a user being assigned to the case would be seen as the first event and, because the the modification _time was being used, it would appear in the wrong place on the sparkline (history / trend graph).
- If a case was closed then its status was changed to a different resolution type then the closure would be double counted.
I resolved these with the following new search query:
index="<client>"
| dedup case_id, status sortby -_time
| reverse
| eval openClosed = case(match(status, "new|in_progress"), "Open", match(status, "resolved_other|resolved_auto"), "Closed")
| streamstats current=f last(status) as lastStatus by case_id
| eval firstEvent = if(openClosed == "Open" AND isnull(lastStatus), "True", "False")
| eval lastEvent = if(openClosed == "Closed", "True", "False")
| where firstEvent == "True" OR lastEvent  == "True"
| dedup case_id, openClosed sortby -_time
| append [| makeresults | eval _time = 0, alert_count = 10000, openClosed = "Closed"]
| eval _time = if(status == "new", strptime(creation_time, "%Y/%m/%d %H:%M:%S"), _time)
| sort +_time
| eval alert_count_change = case(openClosed == "Open", "+" . alert_count, openClosed == "Closed", "-" . alert_count)
| streamstats sum(alert_count_change) as alert_count_open_total
| streamstats min(alert_count_open_total) as alert_count_open_min
| eval alert_count_open_total_nonegatives = case(alert_count_open_total == alert_count_open_min, 0, alert_count_open_total < 0 AND alert_count_open_total > alert_count_open_min, alert_count_open_total - alert_count_open_min, alert_count_open_total > 0 AND alert_count_open_total < alert_count_change, alert_count_change, 1=1, alert_count_open_total)
| table _time, alert_count_open_total_nonegatives, alert_count_open_total, alert_count_change, alert_count, case_id, status, lastStatus, openClosed, firstEvent, lastEvent
Final explanation (hopefully):
- | dedup case_id, status sortby -_time
This gets the latest event per status for each case. This is useful in some cases such as:- An existing case is updated with an increased alert count but the status doesn't change from new.
- A case's assigned user is changed but the status doesn't change from in_progress.
- | reverse
By default, the events are ordered by newest first but streamstats is order-sensitive so we reverse to get the oldest events first otherwise our latest / current value would actually be the oldest. - | eval openClosed = case(match(status, "new|in_progress"), "Open", match(status, "resolved_|etc"), "Closed")
As there are various types of open and closed statuses, this consolidates all of them into simple values for use in upcoming evaluations. - | streamstats current=f last(status) as lastStatus by case_id
This looks at the previous event and stores its status which we'll need for determining whether an event is a "middle" one (not the case creation or closure). - | eval firstEvent = if(openClosed == "Open" AND isnull(lastStatus), "True", "False")
| eval lastEvent = if(openClosed == "Closed", "True", "False")
| where firstEvent == "True" OR lastEvent == "True"
This filters out any of the aforementioned "middle" events, leaving us with the case creation and closure events of which we'll need their alert counts for the sparkline sum. - | dedup case_id, openClosed sortby -_time
Sometimes there are multiple closure events for the same case if, for example, a resolved status was changed to a different type. For those scenarios, this gets the last instance of Closed = the last closure event. - | append [| makeresults | eval _time = 0, alert_count = 10000, openClosed = "Closed"]
A later case evaluation that prevents a count from going negative has a problem where it can't handle a value of 0 so, to resolve that, we need to keep the value away from 0 by creating a negative baseline. To do that, we need to prefix a fake event with (1) an extreme alert count which a later evaluation will convert to negative due to it being closed and (2) a timestamp which is guaranteed to be the first / earliest event. - | eval _time = if(status == "new", strptime(creation_time, "%Y/%m/%d %H:%M:%S"), _time)
In our scenario, each event contains two time fields: creation_time and modification_time, _time being parsed from the latter. So, if the status is new then we need to change the value of _time to a Unix epoch version of creation_time which resolves newly-discovered edge case #2. - | sort +_time
Earlier, we used reverse which put all of the events in the right order but we've since done a few different things which have messed up the timeline so we need to order from oldest to newest events again to ensure that the sparkline is correct. - | eval alert_count_change = case(openClosed == "Open", "+" . alert_count, openClosed == "Closed", "-" . alert_count)
Open and closed cases have the exact same number of alerts because it's only the status that changes but we want the closed cases' alert counts to be subtracted from the open figure and vice versa. Fortunately, a plus-minus equals a minus (something I haven't even thought of since high school which I'm now thankful for) so all we have to do is prefix a minus symbol and the sum command takes care of the rest.
Prefixing the plus symbol isn't necessary but it keeps things easy to read and allows you to search for explicitly positive values.
Also, even though it looks like a string concatenation, the result is actually a number type, as verified by testing with typeof(). - | streamstats sum(alert_count_change) as alert_count_open_total
This sums the (positive and negative) values of the column / fields alert_count_change line by line. - | streamstats min(alert_count_open_total) as alert_count_open_min
| eval alert_count_open_total_nonegatives = case(alert_count_open_total == alert_count_open_min, 0, alert_count_open_total < 0 AND alert_count_open_total > alert_count_open_min, alert_count_open_total - alert_count_open_min, alert_count_open_total > 0 AND alert_count_open_total < alert_count_change, alert_count_change, 1=1, alert_count_open_total)
Sometimes we don't have the events for case creations because they were already closed when the case data was retrieved which results in negative numbers but we can't have negative cases open so, as mentioned earlier, this prevents the value from going negative. Again, big thank you to @ALXWBR for asking this question and to @DavidHourani for answering it at https://community.splunk.com/t5/Splunk-Search/Streamstats-sum-that-doesn-t-go-below-zero/td-p/454371 - | table _time, alert_count_open_total_nonegatives, alert_count_open_total, alert_count_change, alert_count, case_id, status, lastStatus, openClosed, firstEvent, lastEvent
A table is required for statistics, the first value from the left is used for the X axis so we use _time, and the second value is used for the Y axis so we use alert_count_open_total_nonegatives. Everything else is just there in case we need to diagnose a problem or export the data.
If per-severity trends are desired then simply append severity_count_field > 0 to the first search term. Just be aware that this radically changes the sparklines as you can see below:
- Mark as New
- Bookmark Message
- Subscribe to Message
- Mute Message
- Subscribe to RSS Feed
- Permalink
- Report Inappropriate Content
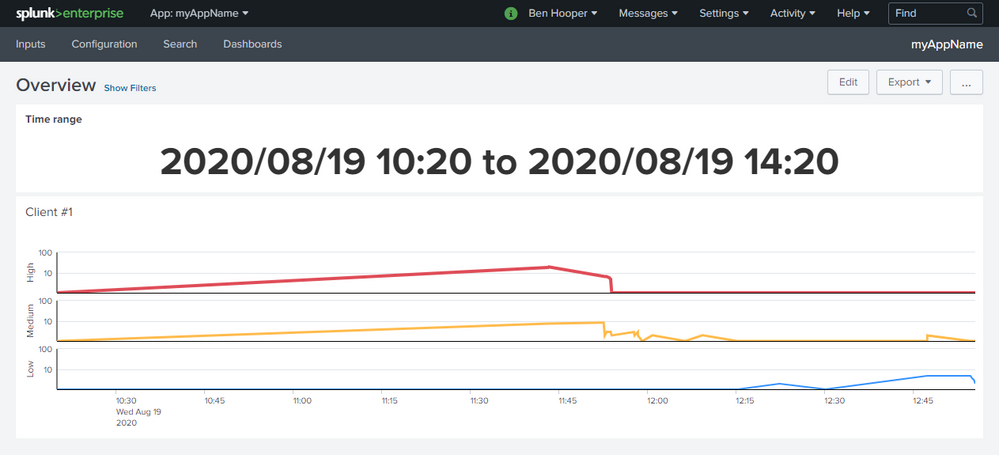
Building off of my last solution, I've also managed to create a kind of "client alerts by severity over time" dashboard.
Full XML source below:
<form>
<label>Overview</label>
<fieldset submitButton="false">
<input type="time" token="TimePicker">
<label>Time range</label>
<default>
<earliest>-24h@h</earliest>
<latest>now</latest>
</default>
</input>
</fieldset>
<row>
<panel>
<single>
<title>Time range</title>
<search>
<query>| makeresults
| addinfo
| eval range_start = strftime(info_min_time,"%Y/%m/%d %H:%M"), range_end = strftime(info_max_time,"%Y/%m/%d %H:%M")
| eval now = strftime(now(),"%Y/%m/%d %H:%M")
| eval range = case(info_min_time == 0 AND match(info_max_time, "Infinity"), "All-time (last updated " . now . ")", info_min_time != 0 AND NOT match(info_max_time, "Infinity"), range_start . " to " . range_end)
| table range</query>
<earliest>$TimePicker.earliest$</earliest>
<latest>$TimePicker.latest$</latest>
<sampleRatio>1</sampleRatio>
<refresh>5s</refresh>
<refreshType>delay</refreshType>
</search>
<option name="colorBy">value</option>
<option name="colorMode">none</option>
<option name="drilldown">none</option>
<option name="height">74</option>
<option name="numberPrecision">0</option>
<option name="refresh.display">progressbar</option>
<option name="showSparkline">1</option>
<option name="showTrendIndicator">1</option>
<option name="trellis.enabled">0</option>
<option name="trellis.scales.shared">1</option>
<option name="trellis.size">medium</option>
<option name="trendColorInterpretation">standard</option>
<option name="trendDisplayMode">absolute</option>
<option name="unitPosition">after</option>
<option name="useColors">0</option>
<option name="useThousandSeparators">1</option>
</single>
</panel>
</row>
<row>
<panel>
<title>Client #1</title>
<html>
<style>
/* Styling for high line */
.highcharts-series-0 text {
font-size: 25px !important;
font-weight: bold !important;
fill: #DF4D58 !important;
}
.highcharts-series-0 path {
stroke-width: 4px;
}
/* Styling for medium line */
.highcharts-series-1 text {
font-size: 20px !important;
font-weight: bold !important;
fill: #FFBB4B !important;
}
.highcharts-series-1 path {
stroke-width: 3px;
}
/* Styling for low line */
.highcharts-series-2 text {
font-size: 15px !important;
font-weight: bold !important;
fill: #3391FF !important;
}
.highcharts-series-2 path {
stroke-width: 2px;
}
/* Styling for bottom grid lines */
.highcharts-yaxis-grid path:first-of-type, .highcharts-axis-line {
stroke: black !important;
}
</style>
</html>
<chart>
<search>
<query>index="<client #1>"
| dedup case_id, status sortby -_time
| reverse
| eval openClosed = case(match(status, "new|in_progress"), "Open", match(status, "resolved_other|resolved_auto"), "Closed")
| streamstats current=f last(status) as lastStatus by case_id
| eval firstEvent = if(openClosed == "Open" AND isnull(lastStatus), "True", "False")
| eval lastEvent = if(openClosed == "Closed", "True", "False")
| where firstEvent == "True" OR lastEvent == "True"
| dedup case_id, openClosed sortby -_time
| append [| makeresults | eval _time = 0, low_alert_count = 10000, med_alert_count = 10000, high_alert_count = 10000, openClosed = "Closed"]
| eval _time = if(status == "new", strptime(creation_time, "%Y/%m/%d %H:%M:%S"), _time)
| append [| makeresults | addinfo | eval _time = info_min_time]
| append [| makeresults | addinfo | eval _time = info_max_time]
| sort by +_time
| eval low_alert_count_change = case(openClosed == "Open", "+" . low_alert_count, openClosed == "Closed", "-" . low_alert_count)
| streamstats sum(low_alert_count_change) as low_alert_count_open_raw
| streamstats min(low_alert_count_open_raw) as low_alert_count_open_min
| eval low_alert_count_open = case(low_alert_count_open_raw == low_alert_count_open_min, 0, low_alert_count_open_raw < 0 AND low_alert_count_open_raw > low_alert_count_open_min, low_alert_count_open_raw - low_alert_count_open_min, low_alert_count_open_raw > 0 AND low_alert_count_open_raw < low_alert_count_change, low_alert_count_change, 1=1, low_alert_count_open_raw)
| eval med_alert_count_change = case(openClosed == "Open", "+" . med_alert_count, openClosed == "Closed", "-" . med_alert_count)
| streamstats sum(med_alert_count_change) as med_alert_count_open_raw
| streamstats min(med_alert_count_open_raw) as med_alert_count_open_min
| eval med_alert_count_open = case(med_alert_count_open_raw == med_alert_count_open_min, 0, med_alert_count_open_raw < 0 AND med_alert_count_open_raw > med_alert_count_open_min, med_alert_count_open_raw - med_alert_count_open_min, med_alert_count_open_raw > 0 AND med_alert_count_open_raw < med_alert_count_change, med_alert_count_change, 1=1, med_alert_count_open_raw)
| eval high_alert_count_change = case(openClosed == "Open", "+" . high_alert_count, openClosed == "Closed", "-" . high_alert_count)
| streamstats sum(high_alert_count_change) as high_alert_count_open_raw
| streamstats min(high_alert_count_open_raw) as high_alert_count_open_min
| eval high_alert_count_open = case(high_alert_count_open_raw == high_alert_count_open_min, 0, high_alert_count_open_raw < 0 AND high_alert_count_open_raw > high_alert_count_open_min, high_alert_count_open_raw - high_alert_count_open_min, high_alert_count_open_raw > 0 AND high_alert_count_open_raw < high_alert_count_change, high_alert_count_change, 1=1, high_alert_count_open_raw)
| where _time != 0
| chart values(high_alert_count_open) as High, values(med_alert_count_open) as Medium, values(low_alert_count_open) as Low by _time</query>
<earliest>$TimePicker.earliest$</earliest>
<latest>$TimePicker.latest$</latest>
<sampleRatio>1</sampleRatio>
<refresh>30s</refresh>
<refreshType>delay</refreshType>
</search>
<option name="charting.axisLabelsX.majorLabelStyle.overflowMode">ellipsisNone</option>
<option name="charting.axisLabelsX.majorLabelStyle.rotation">0</option>
<option name="charting.axisTitleX.visibility">collapsed</option>
<option name="charting.axisTitleY.visibility">collapsed</option>
<option name="charting.axisTitleY2.visibility">visible</option>
<option name="charting.axisX.abbreviation">none</option>
<option name="charting.axisX.scale">linear</option>
<option name="charting.axisY.abbreviation">none</option>
<option name="charting.axisY.scale">linear</option>
<option name="charting.axisY2.abbreviation">none</option>
<option name="charting.axisY2.enabled">0</option>
<option name="charting.axisY2.scale">inherit</option>
<option name="charting.chart">line</option>
<option name="charting.chart.bubbleMaximumSize">50</option>
<option name="charting.chart.bubbleMinimumSize">10</option>
<option name="charting.chart.bubbleSizeBy">area</option>
<option name="charting.chart.nullValueMode">connect</option>
<option name="charting.chart.showDataLabels">none</option>
<option name="charting.chart.sliceCollapsingThreshold">0.01</option>
<option name="charting.chart.stackMode">default</option>
<option name="charting.chart.style">shiny</option>
<option name="charting.drilldown">all</option>
<option name="charting.layout.splitSeries">1</option>
<option name="charting.layout.splitSeries.allowIndependentYRanges">0</option>
<option name="charting.legend.labelStyle.overflowMode">ellipsisEnd</option>
<option name="charting.legend.labels">[High, Medium, Low]</option>
<option name="charting.legend.mode">standard</option>
<option name="charting.legend.placement">right</option>
<option name="charting.lineWidth">2</option>
<option name="charting.seriesColors">[0xDF4D58, 0xFFBB4B, 0x3391FF]</option>
<option name="refresh.display">progressbar</option>
<option name="trellis.enabled">0</option>
<option name="trellis.scales.shared">1</option>
<option name="trellis.size">medium</option>
<drilldown>
<link target="_blank">/app/TA-myAppName/myAppName?form.AlertsOpen.earliest=$TimePicker.earliest$&form.AlertsOpen.latest=$TimePicker.latest$</link>
</drilldown>
</chart>
</panel>
</row>
</form>


