- Find Answers
- :
- Using Splunk
- :
- Splunk Search
- :
- Aggregate query help
- Subscribe to RSS Feed
- Mark Topic as New
- Mark Topic as Read
- Float this Topic for Current User
- Bookmark Topic
- Subscribe to Topic
- Mute Topic
- Printer Friendly Page
- Mark as New
- Bookmark Message
- Subscribe to Message
- Mute Message
- Subscribe to RSS Feed
- Permalink
- Report Inappropriate Content
Hi Team - I am trying to first search and then aggregate results from following Splunk logs:
Raw format:
"buildDimensionsAttributes: $attribute: $constraint: $result"
sample message:
message: buildDimensionsAttributes: 6393: AttributeConstraints(-1.0,99.92,2,DoubleFormat): 99.98Here in the AttributeConstraints
1st index corresponds to minval here -1.0
2nd index corresponds to maxval here 99.92
3rd index corresponds to decimal here 2
I want to first filter $results which are out of range, here 99.98 is not between [-1.0 , 99.92] and then
aggregate (group by) various $attribute and then
showcase something like below on the dashboard where we can apply our usual time filters.
Attribute# | RecrdCountofOutofRange | TotalRecords
Thanks
AG
- Mark as New
- Bookmark Message
- Subscribe to Message
- Mute Message
- Subscribe to RSS Feed
- Permalink
- Report Inappropriate Content
Hi @aag
See if this helps!.
<your_Search_goes_here>
| rex "buildDimensionsAttributes:\s+(?<attr>\d+):\s+AttributeConstraints\((?<idx1>.+?),(?<idx2>.+?),(?<idx3>.+?),.+?\):\s+(?<number>[\d\.]+)"
| stats count as total, count(eval(number < idx1 OR number > idx2 )) as RecordOutRange by attr
---
An upvote would be appreciated if this reply helps and Accept solution!
- Mark as New
- Bookmark Message
- Subscribe to Message
- Mute Message
- Subscribe to RSS Feed
- Permalink
- Report Inappropriate Content
Thanks much @venkatasri ; it worked beautifully !
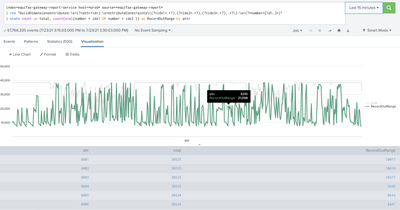
As a next step would like to showcase the result on dashboard, where from a drop down when we select a particular attribute it will show the count of total and RecordOutRange on y-axis in time span of every15min on x-axis. Something like below:
Helpful image from query showcasing all attributes in same graph:
Thanks


