- Find Answers
- :
- Premium Solutions
- :
- Splunk ITSI
- :
- Why are the ITSI Service Health scores not aggrega...
- Subscribe to RSS Feed
- Mark Topic as New
- Mark Topic as Read
- Float this Topic for Current User
- Bookmark Topic
- Subscribe to Topic
- Mute Topic
- Printer Friendly Page
- Mark as New
- Bookmark Message
- Subscribe to Message
- Mute Message
- Subscribe to RSS Feed
- Permalink
- Report Inappropriate Content
Why are the ITSI Service Health scores not aggregating as expected?
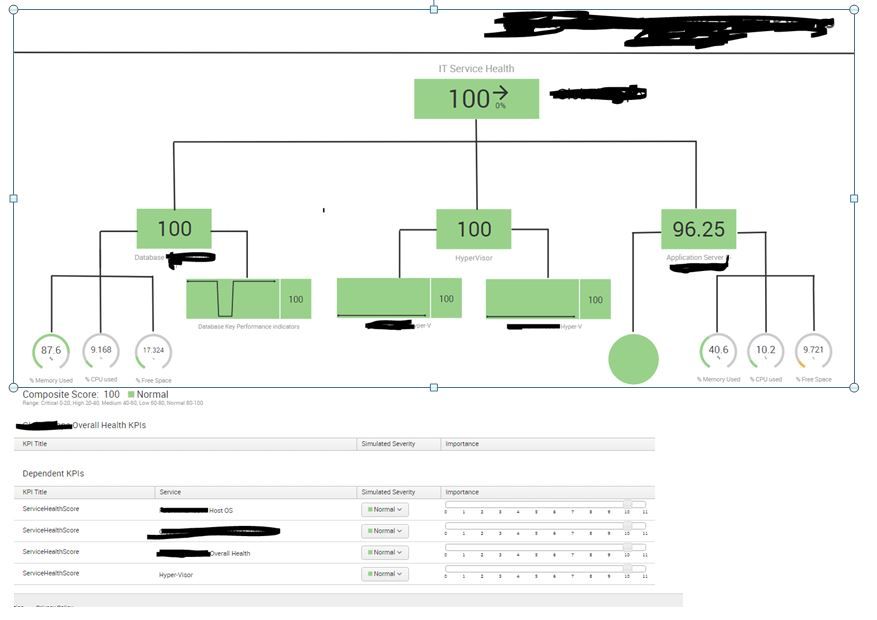
We are having some issues in getting our overall Service Health scores to behave as expected and wondered if anyone has encountered similar or has any advice. The image below included to illustrate:
We are using ITSI glass tables to present a basic view of IT Service. This particular table shows an IT Service which presents an overall Health score based on database service (left), HyperVisor (middle) and Application (right). Those components are in turn made up of lower level KPIs (CPU usage, application health, Database response times etc).
In the example below, the application health is affected by an AMBER alert on Free Space - so the health score for App Service is 96.25 - all good there. However, OVERALL service health continues to show 100 even- though we have given Database, HyperVisor, and Application health the same Importance. Simple logic would expect our overall Health to be somewhere around 98.75% ( e.g.
(100+100+96.25) / 3= 98.753) - but it stays at 100. We have tried playing around with the importance and simulated severity settings but those don't seem to make a difference. The only way I can get the overall IT Service Health score to change in this example is to add the "Application server free space KPI" as a direct dependent KPI - but that's not what we want to do.
Any ideas?
- Mark as New
- Bookmark Message
- Subscribe to Message
- Mute Message
- Subscribe to RSS Feed
- Permalink
- Report Inappropriate Content
Ansif
Thanks for the response - I think I follow (I've only had limited exposure to SPLUNK so far). So, you are saying that the overall Service Health score in my example will only take into account the GREEN "Normal" statuses of the 3 services beneath it, which is why it displays a score of 100, even though one of the others is less that 100 (but is still NORMAL)..?
In our particular use-case, I don't want either the "Application Server" Health score or the "IT Service Health" score to be anything other than green - because there is only 1 KPI in a warning status and we are trying to represent user experience at the top level (i.e. our Service isn't overly affected by the fact that we have a warning on the amount of free space). I'd like our IT Service Health to remain in normal range but to have a composite score of less than 100 so that it reflects the fact that we have a warning beneath it.
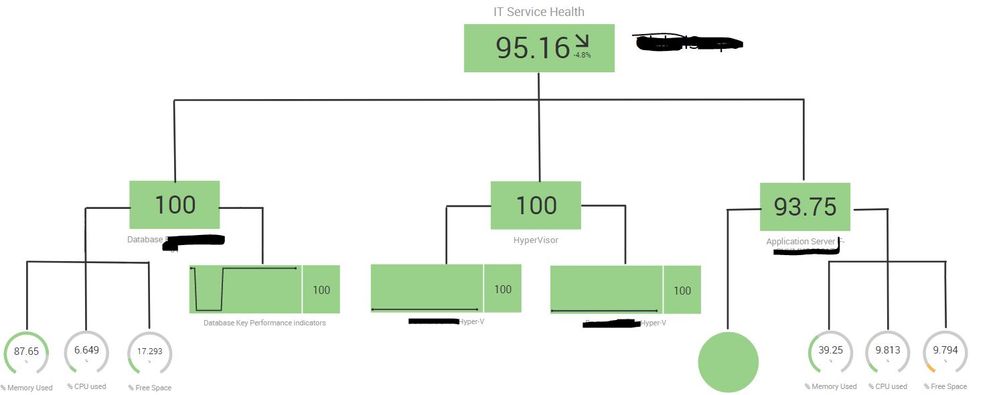
I can (kind of) get it to do something like that, but ONLY if I add the specific KPI for %FREE SPACE in - as you can see in the screenshots below for it..
Doing that skews the top level score and the same would be true if we added ALL of the lowest level KPIS in (as, for example, DB Health has more KPIs than Application Health). We wanted the score at the top level to be aggregate of the 3 different health scores beneath .
Perhaps we are trying to do achieve that the wrong way, so are there suggestions out there on a different method to get the result we require?.
This config. gives us something like the result we want (but not the appopriate overall health score):
alt text
(The overall score is too low because it is overly influenced by the single KPI of Application Server %Free space. If it was working as we want the score would be 97.91 - which is the average of the 3 beneath it: 100+100+93.75 /3 )
Thanks
- Mark as New
- Bookmark Message
- Subscribe to Message
- Mute Message
- Subscribe to RSS Feed
- Permalink
- Report Inappropriate Content
Thanks for the response - I think I follow (I've only had limited exposure to SPLUNK so far). So, you are saying that the overall Service Health score in my example will only take into account the GREEN "Normal" statuses of the 3 services beneath it, which is why it displays a score of 100, even though one of the others is less that 100 (but is still NORMAL)..?
yes
The service health score is not calculating as (1+2+.....+n)/n.
ITSI calculates Service health score in different way and it take "status" in account.
If you still need to get ~97.91,you need to adjust the weightage on KPI level and on Parent service Health score level also.
- Mark as New
- Bookmark Message
- Subscribe to Message
- Mute Message
- Subscribe to RSS Feed
- Permalink
- Report Inappropriate Content
Additional detail:
Health score is calculated as weighted sum of all KPI status * importance 🙂
Upvote and Accept answer if it works.
- Mark as New
- Bookmark Message
- Subscribe to Message
- Mute Message
- Subscribe to RSS Feed
- Permalink
- Report Inappropriate Content
How ITSI Score works?
@RussSmith : Please find the below details,
In the above example,taking Database:
%Memory Used : 87.6 Normal
%CPU Used : 9.168 Normal
%Free Space : 17.324 Normal
See the composite score is showing 100% since all KPI's are Normal.When you change the severity to simulate like if CPU Utilization went Medium your over score get change.
Now coming to your question,you wish to see the overall score as not 100%.In that case you need to define like below:
In the above screenshot you could see that if free space is medim then overall score is 80 and in Low Status (not Normal)
So it is required to define KPI in such a manner it should change the status of over all score.
Since the overall status changed now it will get reflect in Parent Service.
NB:- The overall score calculation is based on Status also.


