Are you a member of the Splunk Community?
- Find Answers
- :
- Premium Solutions
- :
- Splunk ITSI
- :
- Why are notable events not appearing from my multi...
- Subscribe to RSS Feed
- Mark Topic as New
- Mark Topic as Read
- Float this Topic for Current User
- Bookmark Topic
- Subscribe to Topic
- Mute Topic
- Printer Friendly Page
- Mark as New
- Bookmark Message
- Subscribe to Message
- Mute Message
- Subscribe to RSS Feed
- Permalink
- Report Inappropriate Content

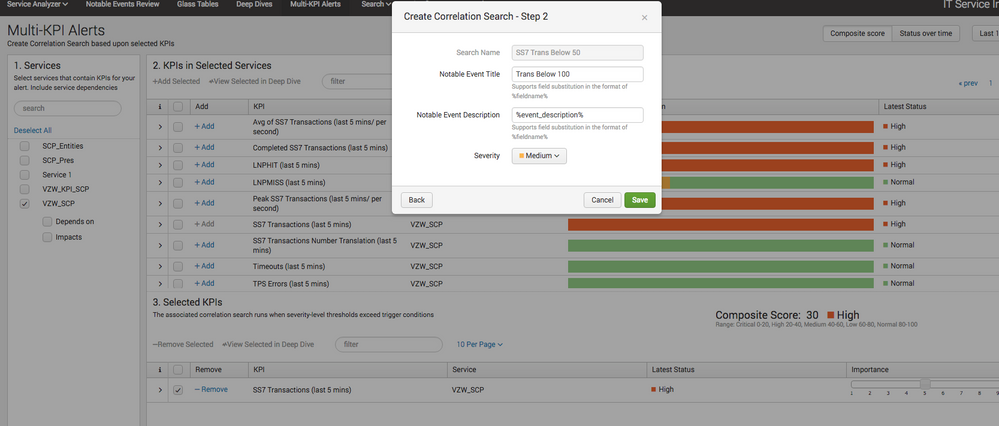
Yet no events are appearing ... I have enabled the correlation search... Can anyone think of any other suggestions why it may not be triggering? I'm completely at a loss.
- Mark as New
- Bookmark Message
- Subscribe to Message
- Mute Message
- Subscribe to RSS Feed
- Permalink
- Report Inappropriate Content
One thing to check is whether the correlation search is creating an event in itsi_tracked_alerts index, if there are no events, then run the correlation search manually and see if you get results for the timeframe in question. If there are events being created in itsi_tracked_alerts and you do not see Notable Events, try turning off the Event Grouping while in Notable Events Review. Click on the gear icon for View Settings, then select off for Event Grouping, once you hit Done, the ungrouped Notable Events should now be visible.
If this is the case, where ungrouped NE's are visible, but Grouped are not, check to see if Java is installed on the server per our docs:
https://docs.splunk.com/Documentation/ITSI/latest/Configure/DeploymentPlanning#Java_requirements
- Mark as New
- Bookmark Message
- Subscribe to Message
- Mute Message
- Subscribe to RSS Feed
- Permalink
- Report Inappropriate Content
Yes, all I needed to do was turn OFF Event Grouping. Can you explain why having it ON would prevent any events from appearing?
- Mark as New
- Bookmark Message
- Subscribe to Message
- Mute Message
- Subscribe to RSS Feed
- Permalink
- Report Inappropriate Content
Event Grouping is used to gather like Notable events, which are stored in the itsi_tracked_alerts index. Having Event Grouping "On", searches the itsi_grouped_alerts index, however, without Java driving the NEAP engine that creates those events, the itsi_grouped_alerts index never populates.
Notable Events are stored in itsi_tracked_alerts
Notable Events that have been put into a group are maintained in itsi_grouped_alerts based on NEAP (Notable Event Aggregation Policy) For each group, there is a first/opening NE, and a last/closing NE
Having Event Grouping set to "On" searches the itsi_grouped_alerts index
Having Event Grouping set to "Off" searches the itsi_tracked_alerts index
- Mark as New
- Bookmark Message
- Subscribe to Message
- Mute Message
- Subscribe to RSS Feed
- Permalink
- Report Inappropriate Content
Also please note that I had to install Java on my server that ITSI was installed on so it could do Notable Events Aggregation
- Mark as New
- Bookmark Message
- Subscribe to Message
- Mute Message
- Subscribe to RSS Feed
- Permalink
- Report Inappropriate Content
I am literally running the searches from the Correlation Search config screen and it is returning results but refuses to put them into the Notable Events Review page, no matter what I do. What am I missing?
