- Find Answers
- :
- Premium Solutions
- :
- Splunk ITSI
- :
- What is the difference in ITSI thresholds between ...
- Subscribe to RSS Feed
- Mark Topic as New
- Mark Topic as Read
- Float this Topic for Current User
- Bookmark Topic
- Subscribe to Topic
- Mute Topic
- Printer Friendly Page
- Mark as New
- Bookmark Message
- Subscribe to Message
- Mute Message
- Subscribe to RSS Feed
- Permalink
- Report Inappropriate Content
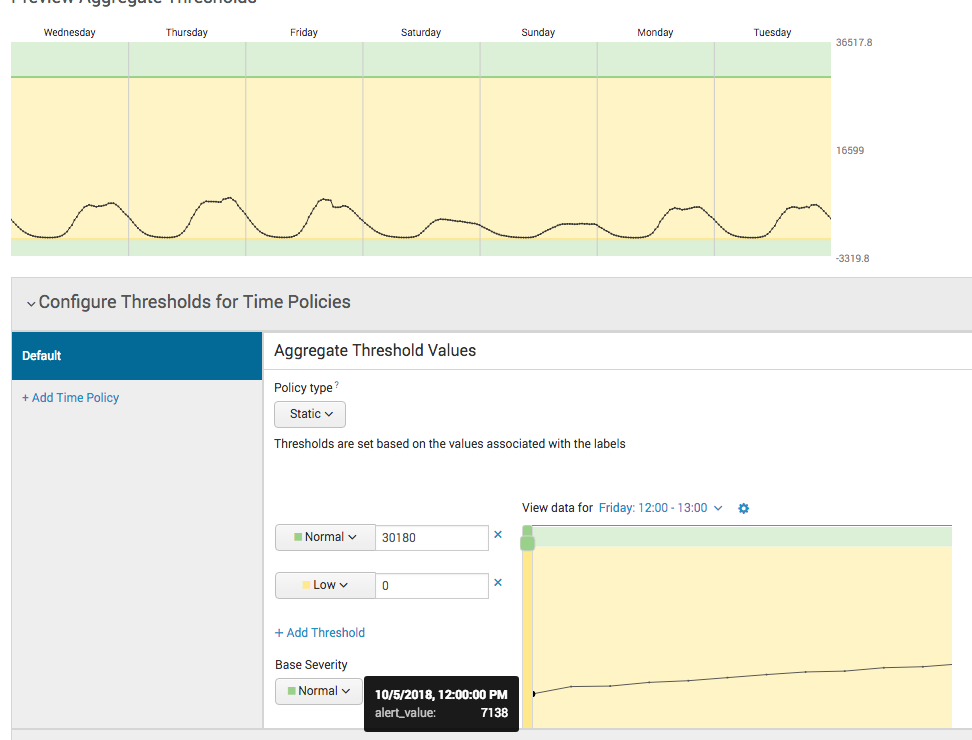
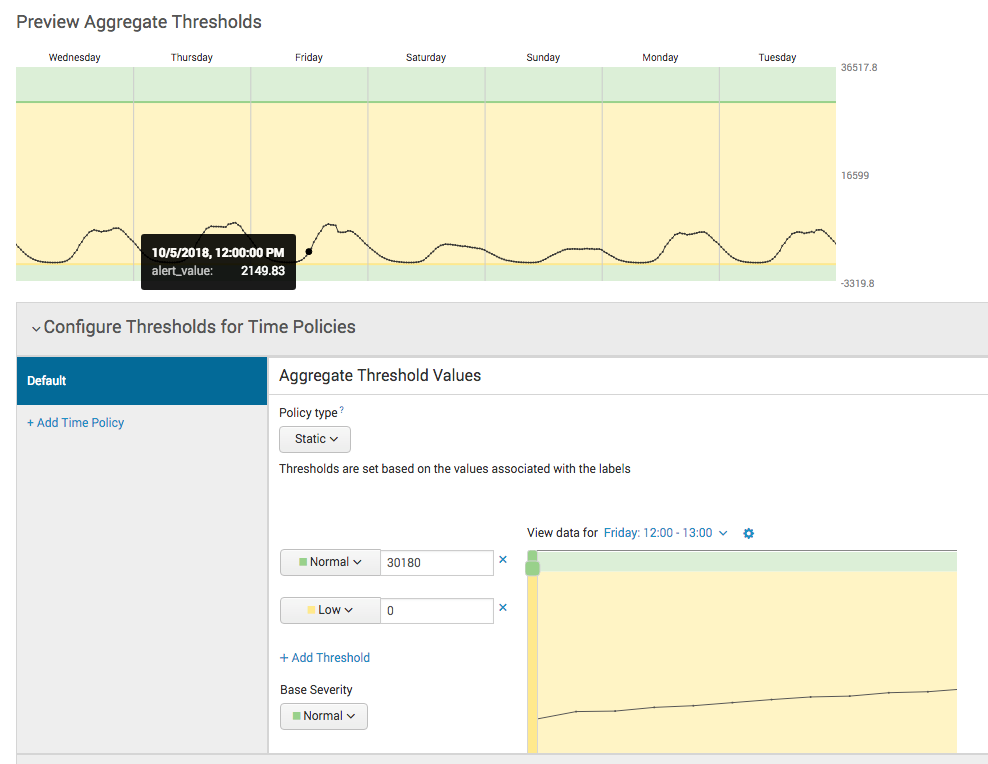
I am seeing a difference in data (see screenshots) between the data previewed in the Preview Aggregate Thresholds and the data previewed below it under the Configure Thresholds for Time Policy. Does anyone know why these values would be different? Is the top one some kind of average of something?
You can see in the screenshots that for Friday, October 15th, 2018 at 12:00:00 PM, the top one shows a value of 2149.83 and the bottom shows a value of 7138.
- Mark as New
- Bookmark Message
- Subscribe to Message
- Mute Message
- Subscribe to RSS Feed
- Permalink
- Report Inappropriate Content
It should be whatever you sent the calculation metric to when developing the kpi value. Are you looking over the same time window in both screenshots?
Rather than measuring a value at a single point in time, it would be better to pick 2 points in time and measure the sum from both time values. You can also look in the itsi_summary index and create your own timechart based on the value to determine which screenshot is correct
- Mark as New
- Bookmark Message
- Subscribe to Message
- Mute Message
- Subscribe to RSS Feed
- Permalink
- Report Inappropriate Content
@skoelpin
After some investigation, it seems that the value in the Preview Aggregate Threshold takes a kpi value sample. You can see from my search using itsi_summary that I found a value of 16 for 1:00 am on 10/9. and below that you can see that in the Preview Aggregate Threshold window there is a value for 16.17. I thought perhaps the decimal indicated that it was an average but I added up the values in the last 5 mins before 1:00 am and it didn't come out to 16.17.
You can see also I ran a query and asked for the sum of the last 5 mins and this seems to match the values in the chart below where the actual thresholds are set. I wont let me add any more attachments but basicallly the numbers matched for a sum of last 5 mins with the bottom preview chart.
So it seems the Preview Aggregate Threshold is a sampling of a kpi despite what calculation you asked for in the Base search while the lower one near the actual input for the threshold is the calculation of the kpi that you asked for.
Interestingly enough, these two number seemed very close to each other when I asked for an Average in the KPI base search rather than a sum.
- Mark as New
- Bookmark Message
- Subscribe to Message
- Mute Message
- Subscribe to RSS Feed
- Permalink
- Report Inappropriate Content
Nice research!
- Mark as New
- Bookmark Message
- Subscribe to Message
- Mute Message
- Subscribe to RSS Feed
- Permalink
- Report Inappropriate Content
It should be whatever you sent the calculation metric to when developing the kpi value. Are you looking over the same time window in both screenshots?
Rather than measuring a value at a single point in time, it would be better to pick 2 points in time and measure the sum from both time values. You can also look in the itsi_summary index and create your own timechart based on the value to determine which screenshot is correct
- Mark as New
- Bookmark Message
- Subscribe to Message
- Mute Message
- Subscribe to RSS Feed
- Permalink
- Report Inappropriate Content
Sorry, what you are saying isn't making sense to me.
The first part did. Yes, I set the metric to SUM a particular KPI value. The bottom screenshot seems to display that metric correctly. The top one does not.
I dont understand your second recommendation. Why would I pick 2 points in time and measure the sum from both time values? Im trying to compare the data from one chart to another and verify it is the same data.
- Mark as New
- Bookmark Message
- Subscribe to Message
- Mute Message
- Subscribe to RSS Feed
- Permalink
- Report Inappropriate Content
What I'm saying is you should measure the values over a span of time rather than a single point in time. You should run a timechart over the itsi_summary index for a set span of time and identify the value then compare it with your charts. You could be looking at different spans of time which may be leading to wrong values


