- Find Answers
- :
- Premium Solutions
- :
- Splunk ITSI
- :
- ITSI how to fix KPI sparklines?
- Subscribe to RSS Feed
- Mark Topic as New
- Mark Topic as Read
- Float this Topic for Current User
- Bookmark Topic
- Subscribe to Topic
- Mute Topic
- Printer Friendly Page
- Mark as New
- Bookmark Message
- Subscribe to Message
- Mute Message
- Subscribe to RSS Feed
- Permalink
- Report Inappropriate Content
ITSI how to fix KPI sparklines?
Hello, everybody!
I have some experience with Splunk Enterprise, but I'm relatively new to ITSI. I noticed, that IT Service Intelligence App sometimes (in fact - often, if not even always) shows KPI sparklines having wrong values. For test purposes I created two KPIs based on | inputlookup - so, these can't have any null results regardless of "KPI Search Schedule" and "Calculation Window".
Here is what I have (blue rectangles on screenshot):
My KPI "Cluster Nodes are UP by Node" for host2 (right on screenshot) always has value=1 for now (this is constant value in lookup), but KPI sparkline value continuously changes from 0 to 1 and back. That is wrong, looks like measured service value changes, but it is not. Sparkline must show straight line at 1 value!
My KPI "Cluster Nodes are UP by Node" (left on screenshot) also always has value=1 for now, but KPI sparkline shows it continuously changes from 0 to 1 and back.
Since Splunk ITSI is nothing but a monitoring solution, this is a real problem to the end-users. These sparklines confuse and I really wonder how I can fix this. I need some help how can I review the app/itsi/homeview dashboard code and maybe even change it a little bit to fix the problem.
- Mark as New
- Bookmark Message
- Subscribe to Message
- Mute Message
- Subscribe to RSS Feed
- Permalink
- Report Inappropriate Content
The issue here is actually with the rendering engine of the sparkline or something about how core splunk (not ITSI) passes the values to the sparkline for rendering. If the time range is small enough (say last 60m) then that's small enough to bucket results passed to the sparkline into 1m spans which will result in 4 out of every 5 buckets not having a datapoint. (for a 5 minute KPI anyway)
Interestingly enough, as per this answers post: https://community.splunk.com/t5/Archive/Sparkline-Format/td-p/61136 the sparkline rendering can be altered in SimpleXML and I've tested it with a dashboard. It would be a total ITSI hack, but it might well be possible to identify the conf file where the sparkline rendering config is passed for the service analyzer and modify to instead show a bar chart... the following results might look something more like this...
- Mark as New
- Bookmark Message
- Subscribe to Message
- Mute Message
- Subscribe to RSS Feed
- Permalink
- Report Inappropriate Content
@oshirnin,
After looking at your question and comments I think you should set Fill Data Gaps with to "connect" then you will see continuous line on 1. Your current configuration looks to be on "0" value for "Fill Data Gaps with".
Hope this helps!!!
- Mark as New
- Bookmark Message
- Subscribe to Message
- Mute Message
- Subscribe to RSS Feed
- Permalink
- Report Inappropriate Content
@VatsalJagani, hello! Sorry for the long response time, thank you for the patience. I tested carefully, unfortunately your advice does not help.
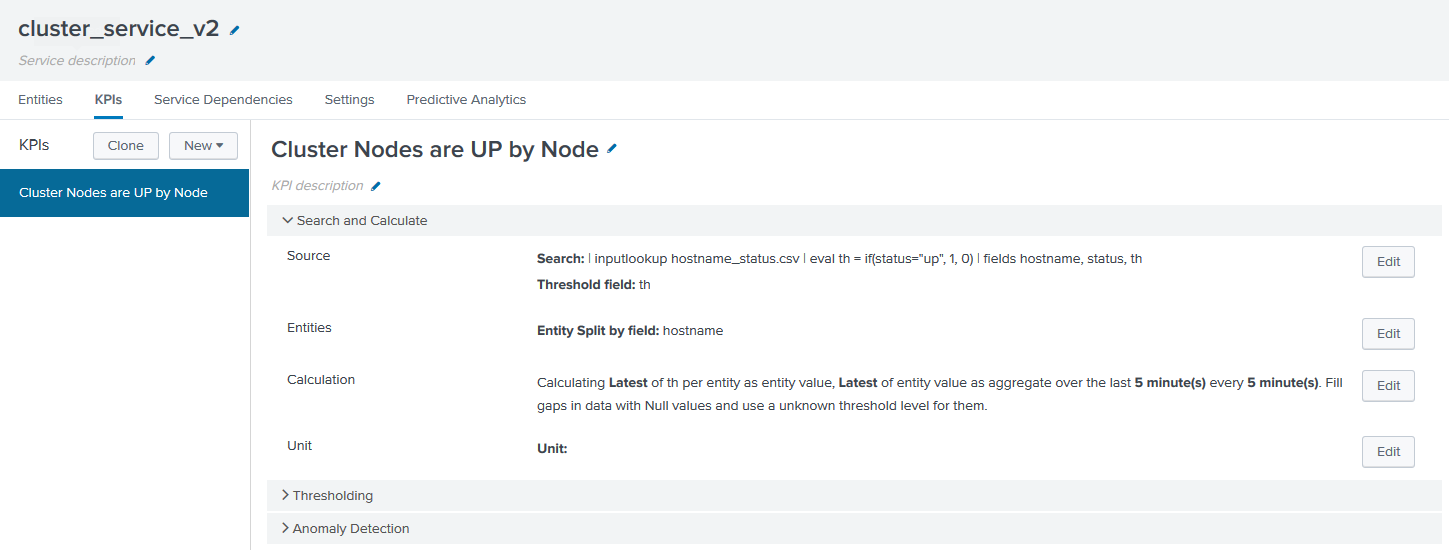
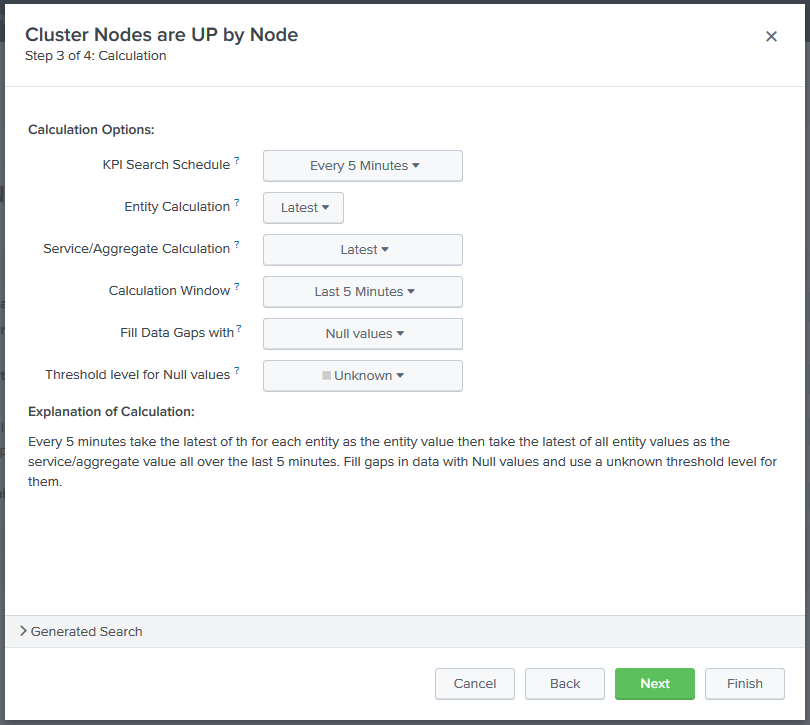
At first, my KPI was really set with 'Fill gaps in data with Null values' as you guessed:


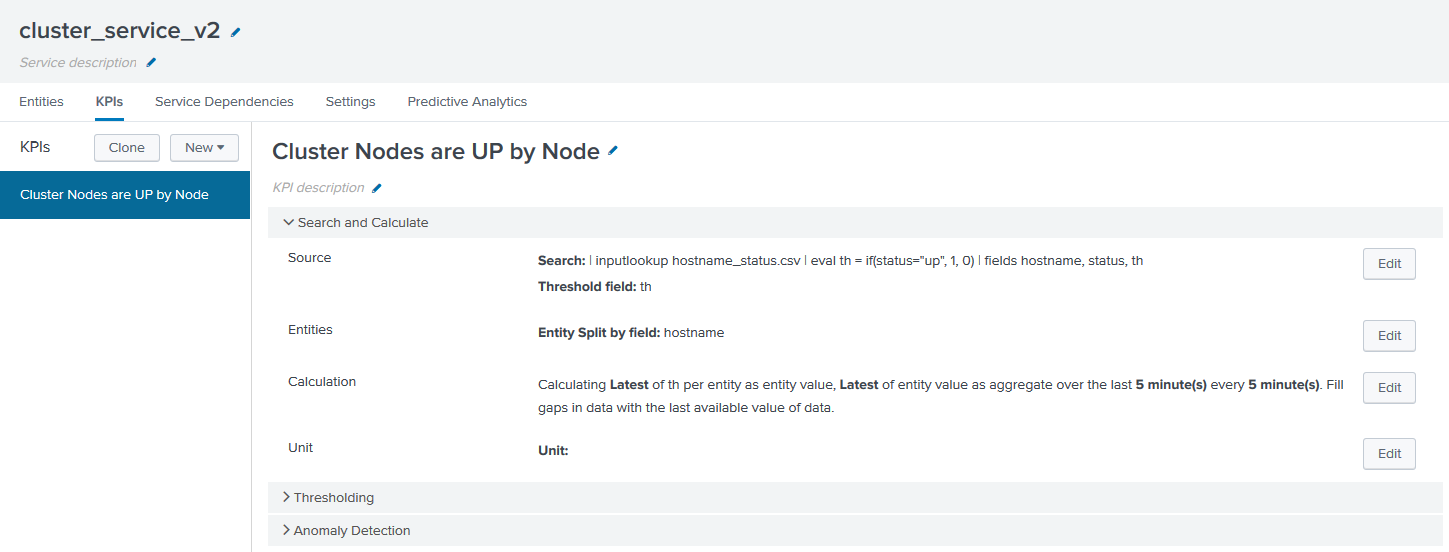
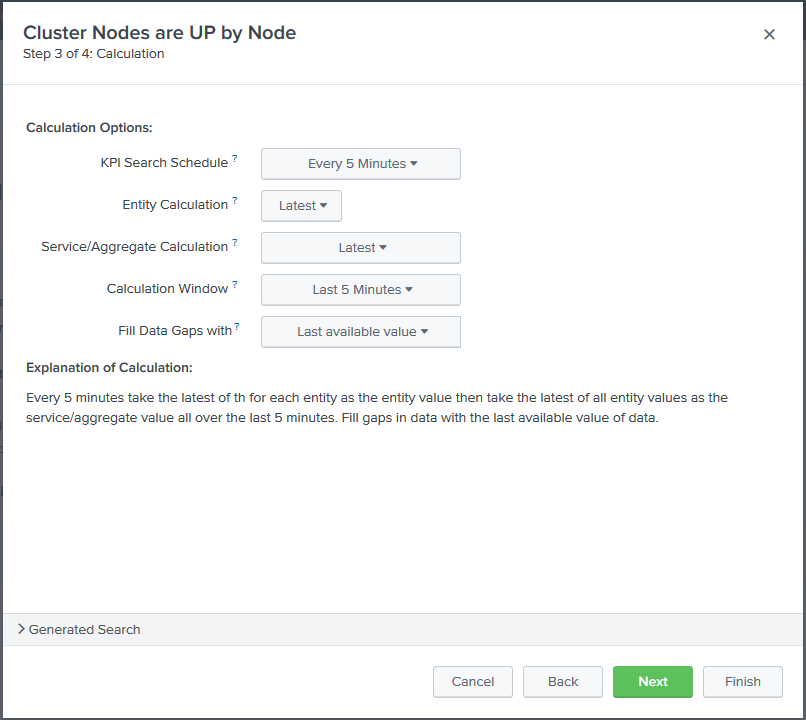
I changed this setting to 'Fill gaps in data with last available value of data' as you suggested:


I waited for some time for KPI to be recalculated and checked the ITSI Service Analyzer, nothing changed:

My KPI always have constant value, it is built on non-changing lookup. However, KPI sparklines in Service Analyzer continuously changes from 0 to 1 and back, that is wrong.
I also mentioned, that changing Service Analyzer time interval from 'Last 1h' to longer values - 'Last 2h', 'Last 12h' helps a little bit, but even in this case there is a problem on the right end of the line:


I am quite sure, that 'Fill gaps in data with' affects only the KPI value calculation, if there is a gap in data, but does not apply to value sparkline display. It looks like there is a hard-coded timechart query with relatively low span, compared to the KPI execution interval. Therefore, this query predictably returns some Null values. After that there is a Graph Chart, which is hard-code configured with 'Null Values - Zero' visualization format, but it should be configured with 'Null Values - Connected'. I am looking a way to achieve this, @VatsalJagani can you maybe help me find where this dashboard is stored? I would like to review the XML and maybe fix it. I understand well what limitations this will lead!
- Mark as New
- Bookmark Message
- Subscribe to Message
- Mute Message
- Subscribe to RSS Feed
- Permalink
- Report Inappropriate Content
@oshirnin - Can you provide your configurations, like everything your search timerange, search time span, frequency of search execution.
- Mark as New
- Bookmark Message
- Subscribe to Message
- Mute Message
- Subscribe to RSS Feed
- Permalink
- Report Inappropriate Content
@VatsalJagani here is what I have. All my KPIs are based on the very simple lookup
| inputlookup hostname_status.csv
hostname | status
---------------------------
host1         | down
host2         | up
host3         | up
My KPI "Cluster Nodes are UP by Node" runs every 5 min on last 5 min data (it doesn't really matter as the underlying data is the static lookup). Complete KPI configuration is the following:
[Indicator - 033d8644924e3d7c4e2724ec - ITSI Search]
action.indicator = 1
action.indicator._itsi_kpi_id = 033d8644924e3d7c4e2724ec
action.indicator._itsi_service_id = 1f78e07e-bbfd-4f31-8e33-67224008e498
alert.suppress = 0
alert.track = 0
cron_schedule = 2-59/5 * * * *
description = Auto created scheduled search during kpi creation
dispatch.earliest_time = -300s
dispatch.latest_time = now
enableSched = 1
search = | inputlookup hostname_status.csv | eval th = if(status="up", 1, 0) | fields hostname, status, th | eval alert_value = th | `gettime` | eval sec_grp = "default_itsi_security_group" | `match_entities(hostname, sec_grp)` | eval serviceid = "1f78e07e-bbfd-4f31-8e33-67224008e498" | `aggregate_entity_into_service(sum)` | `assess_severity(1f78e07e-bbfd-4f31-8e33-67224008e498, 033d8644924e3d7c4e2724ec, true, true, true)` | eval kpi="Cluster Nodes are UP by Node", urgency="5", alert_period="5", serviceid="1f78e07e-bbfd-4f31-8e33-67224008e498" | `assess_urgency`
Hope you have some ideas on the issue.
- Mark as New
- Bookmark Message
- Subscribe to Message
- Mute Message
- Subscribe to RSS Feed
- Permalink
- Report Inappropriate Content
Please check my answer and let me know if that works.


