Are you a member of the Splunk Community?
- Find Answers
- :
- Splunk Platform
- :
- Splunk Enterprise
- :
- Re: Ingestion Latency after updating to 8.2.1
- Subscribe to RSS Feed
- Mark Topic as New
- Mark Topic as Read
- Float this Topic for Current User
- Bookmark Topic
- Subscribe to Topic
- Mute Topic
- Printer Friendly Page
- Mark as New
- Bookmark Message
- Subscribe to Message
- Mute Message
- Subscribe to RSS Feed
- Permalink
- Report Inappropriate Content
Why are we receiving this ingestion latency error after updating to 8.2.1?
So we just updated to 8.2.1 and we are now getting an Ingestion Latency error…
How do we correct it? Here is what the link says and then we have an option to view the last 50 messages...
Ingestion Latency
- Root Cause(s):
- Events from tracker.log have not been seen for the last 6529 seconds, which is more than the red threshold (210 seconds). This typically occurs when indexing or forwarding are falling behind or are blocked.
- Events from tracker.log are delayed for 9658 seconds, which is more than the red threshold (180 seconds). This typically occurs when indexing or forwarding are falling behind or are blocked.
- Generate Diag?If filing a support case, click here to generate a diag.
Here are some examples of what is shown as the messages:
- 07-01-2021 09:28:52.276 -0500 INFO TailingProcessor [66180 MainTailingThread] - Adding watch on path: C:\Program Files\Splunk\var\spool\splunk.
- 07-01-2021 09:28:52.276 -0500 INFO TailingProcessor [66180 MainTailingThread] - Adding watch on path: C:\Program Files\Splunk\var\run\splunk\search_telemetry.
- 07-01-2021 09:28:52.276 -0500 INFO TailingProcessor [66180 MainTailingThread] - Adding watch on path: C:\Program Files\Splunk\var\log\watchdog.
- 07-01-2021 09:28:52.276 -0500 INFO TailingProcessor [66180 MainTailingThread] - Adding watch on path: C:\Program Files\Splunk\var\log\splunk.
- 07-01-2021 09:28:52.276 -0500 INFO TailingProcessor [66180 MainTailingThread] - Adding watch on path: C:\Program Files\Splunk\var\log\introspection.
- 07-01-2021 09:28:52.275 -0500 INFO TailingProcessor [66180 MainTailingThread] - Adding watch on path: C:\Program Files\Splunk\etc\splunk.version.
07-01-2021 09:28:52.269 -0500 INFO TailingProcessor [66180 MainTailingThread] - Adding watch on path: C:\Program Files\CrushFTP9\CrushFTP.log.
- 07-01-2021 09:28:52.268 -0500 INFO TailingProcessor [66180 MainTailingThread] - Parsing configuration stanza: monitor://$SPLUNK_HOME\var\log\watchdog\watchdog.log*.
- 07-01-2021 09:28:52.267 -0500 INFO TailingProcessor [66180 MainTailingThread] - Parsing configuration stanza: monitor://$SPLUNK_HOME\var\log\splunk\splunk_instrumentation_cloud.log*.
- 07-01-2021 09:28:52.267 -0500 INFO TailingProcessor [66180 MainTailingThread] - Parsing configuration stanza: monitor://$SPLUNK_HOME\var\log\splunk\license_usage_summary.log.
- 07-01-2021 09:28:52.267 -0500 INFO TailingProcessor [66180 MainTailingThread] - Parsing configuration stanza: monitor://$SPLUNK_HOME\var\log\splunk.
- 07-01-2021 09:28:52.267 -0500 INFO TailingProcessor [66180 MainTailingThread] - Parsing configuration stanza: monitor://$SPLUNK_HOME\var\log\introspection.
- 07-01-2021 09:28:52.267 -0500 INFO TailingProcessor [66180 MainTailingThread] - Parsing configuration stanza: monitor://$SPLUNK_HOME\etc\splunk.version.
- 07-01-2021 09:28:52.267 -0500 INFO TailingProcessor [66180 MainTailingThread] - Parsing configuration stanza: batch://$SPLUNK_HOME\var\spool\splunk\tracker.log*.
- 07-01-2021 09:28:52.266 -0500 INFO TailingProcessor [66180 MainTailingThread] - Parsing configuration stanza: batch://$SPLUNK_HOME\var\spool\splunk\...stash_new.
- 07-01-2021 09:28:52.266 -0500 INFO TailingProcessor [66180 MainTailingThread] - Parsing configuration stanza: batch://$SPLUNK_HOME\var\spool\splunk\...stash_hec.
- 07-01-2021 09:28:52.266 -0500 INFO TailingProcessor [66180 MainTailingThread] - Parsing configuration stanza: batch://$SPLUNK_HOME\var\spool\splunk.
- 07-01-2021 09:28:52.265 -0500 INFO TailingProcessor [66180 MainTailingThread] - Parsing configuration stanza: batch://$SPLUNK_HOME\var\run\splunk\search_telemetry\*search_telemetry.json.
- 07-01-2021 09:28:52.265 -0500 INFO TailingProcessor [66180 MainTailingThread] - TailWatcher initializing...
- Mark as New
- Bookmark Message
- Subscribe to Message
- Mute Message
- Subscribe to RSS Feed
- Permalink
- Report Inappropriate Content
apologies for the delay....
Yes, all operating as expected post workaround
- Mark as New
- Bookmark Message
- Subscribe to Message
- Mute Message
- Subscribe to RSS Feed
- Permalink
- Report Inappropriate Content
Glad it works for you, unfortunately it made no change in my environment.
- Mark as New
- Bookmark Message
- Subscribe to Message
- Mute Message
- Subscribe to RSS Feed
- Permalink
- Report Inappropriate Content
I'm raising my eyebrow at this being a true work around (but certainly hoping that it is). Where I do agree that queues get blocked on the forwarding nodes the verbage is a bit vague.
I've been fighting this issue for weeks and have been on the exact page looking for the issue and didn't find it. I was searching for "ingestion latency" not blocked queues. Block queue is a broad category and usually a performance reason why it's blocked.
If you make it 3 or 4 days without the issue popping back up I'd say this workaround is solid.
Anyway fingers crossed
- Mark as New
- Bookmark Message
- Subscribe to Message
- Mute Message
- Subscribe to RSS Feed
- Permalink
- Report Inappropriate Content
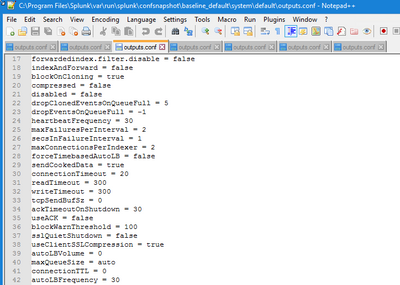
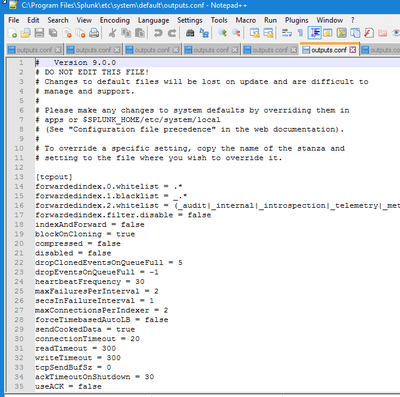
So we have 7 outputs.conf...only 2 have useAck and they are both set to false already.
Not all of the output files are the same:
Should those copies have that value added?
- Mark as New
- Bookmark Message
- Subscribe to Message
- Mute Message
- Subscribe to RSS Feed
- Permalink
- Report Inappropriate Content
Turning off useAck is a compliance finding for anyone following STIG.
Definitely not a fix, but at least it narrows the issue down for Splunk.
- Mark as New
- Bookmark Message
- Subscribe to Message
- Mute Message
- Subscribe to RSS Feed
- Permalink
- Report Inappropriate Content
It doesn't fix my issue. The support has provided some workaroud:
useAck = false
[queue]
maxSize = 100MB
But all those don't help my at all. Please let me know if you guys have any solutions.
Tks.
Linh
- Mark as New
- Bookmark Message
- Subscribe to Message
- Mute Message
- Subscribe to RSS Feed
- Permalink
- Report Inappropriate Content
So I had a support ticket open and this was the next thing we tried:
"I was performing a health check based on the provided diag file and get a warning in regards to File descriptor cache stress.
When the Splunk file descriptor cache is full, it will not be able to effectively tail all the files it should, sometimes resulting in missed
or late data. In this case an important setting that can be adjusted in limits.conf, I'm speaking about the attribute max_fd under
the [inputproc] stanza, you may test to set it as max_fd = 300. Please notice that to set custom configurations, you need to do it on
a local directory of limits.conf and you must restart the Splunk instance to enable configuration changes. For more details, please review
the following document: https://docs.splunk.com/Documentation/Splunk/latest/Admin/Limitsconf (https://docs.splunk.com/Documentation/Splunk/latest/Admin/Limitsconf)"
However that didn't fix the issue and they said we need more CPU/Cores as we are currently running 4 cores (and have been for years with no issues) and that we need to have 12 now after that upgrade (and all other upgrades after).
So we are going to get a couple of new CPU's and see if that helps...we will update after we upgrade the sever.


