- Find Answers
- :
- Splunk Platform
- :
- Splunk Enterprise
- :
- Splunk Query issue
- Subscribe to RSS Feed
- Mark Topic as New
- Mark Topic as Read
- Float this Topic for Current User
- Bookmark Topic
- Subscribe to Topic
- Mute Topic
- Printer Friendly Page
- Mark as New
- Bookmark Message
- Subscribe to Message
- Mute Message
- Subscribe to RSS Feed
- Permalink
- Report Inappropriate Content
Hello Splunkers!!

As per my below query I am not getting group & error_description fields from the query. Please advise what need to be modify in the last line of the query to get the results of those fields.

index=2313917_2797418_scada
| xpath outfield=ErrorType  "//ErrorType"
| search ErrorType IN("OPERATIONAL", "TECHNICAL")
 |xpath outfield=AreaID  "//AreaID"
| xpath outfield=ZoneID  "//ZoneID"
| xpath outfield=EquipmentID  "//EquipmentID"
| xpath outfield=MIS_Address  "//MIS_Address"
| xpath outfield=State  "//State"
| xpath outfield=ElementID  "//ElementID"
| rex field=_raw "eqtext\:Description\>(?P<description>.+)\<\/eqtext\:Description"
|rename EquipmentID as equipment ZoneID as zone AreaID as area ElementID as element State as error_status MIS_Address as error
| eval isc_id=area.".".zone.".".equipment
| search isc_id="*" area="*" zone="*" equipment="*"
| eval start_time=exact(coalesce(start_time,'_time')), _virtual_=if(isnull(virtual),"N","Y"), _cd_=replace('_cd',".*:","")
| fields + _time, isc_id, area, zone, equipment, element, error, start_time error_status
| sort 0 -_time _virtual_ -"_indextime" -_cd_
| dedup isc_id
| fields - _virtual_, _cd_
| eval _time=start_time
| lookup isc.csv id AS isc_id output statistical_subject mark_code
| lookup detail_status.csv component_type_id AS statistical_subject output alarm_severity description operational_rate technical_rate
| search alarm_severity="*" mark_code="*"
| fillnull value=0 technical_rate operational_rate
| eval start_time=exact(coalesce(start_time,'_time')), description=coalesce(description,("Unknown text for error number " . error)), error_description=((error . "-") . description), group=((isc_id . error) . start_time)- Mark as New
- Bookmark Message
- Subscribe to Message
- Mute Message
- Subscribe to RSS Feed
- Permalink
- Report Inappropriate Content
Try without the brackets around the concatenated strings
| eval start_time=exact(coalesce(start_time,'_time')), description=coalesce(description,("Unknown text for error number " . error)), error_description=error . "-" . description, group=isc_id . error . start_time- Mark as New
- Bookmark Message
- Subscribe to Message
- Mute Message
- Subscribe to RSS Feed
- Permalink
- Report Inappropriate Content
@ITWhisperer Actually below query was not giving the results that is why error field was not populated.
| xpath outfield=MIS_Address "//MIS_Address"
I have removed above query and replaced by "| rex field=_raw "eqtext\:MIS_Address\>(?<error>.+)\<\/eqtext\:MIS_Address" and error field are now populating.
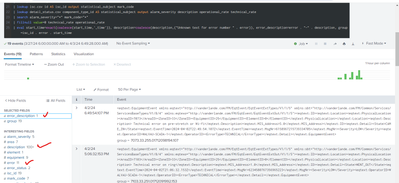
But now I am seeing another issue. As per the below screenshot only one count is visible from "error_description" as error count is 11 or description count is 100+
- Mark as New
- Bookmark Message
- Subscribe to Message
- Mute Message
- Subscribe to RSS Feed
- Permalink
- Report Inappropriate Content
You could try using spath rather than xpath as it handles JSON and XML
- Mark as New
- Bookmark Message
- Subscribe to Message
- Mute Message
- Subscribe to RSS Feed
- Permalink
- Report Inappropriate Content
@ITWhisperer Events are coming in xml format. That is why I am using xpath.
Above queries are running slow. Could you please advice me how I can optimize ?
- Mark as New
- Bookmark Message
- Subscribe to Message
- Mute Message
- Subscribe to RSS Feed
- Permalink
- Report Inappropriate Content
@ITWhisperer Can I use "| mvexpand description" I think description field is having multi value and cause the issue of the single count value from the error_description.

