- Find Answers
- :
- Splunk Platform
- :
- Splunk Enterprise
- :
- Splunk App for Infrastructure: You do not have per...
- Subscribe to RSS Feed
- Mark Topic as New
- Mark Topic as Read
- Float this Topic for Current User
- Bookmark Topic
- Subscribe to Topic
- Mute Topic
- Printer Friendly Page
- Mark as New
- Bookmark Message
- Subscribe to Message
- Mute Message
- Subscribe to RSS Feed
- Permalink
- Report Inappropriate Content
Splunk App for Infrastructure: You do not have permissions to access objects of user
Hello,
I am relatively new to Splunk Enterprise and recently started with the App for Infrastructure to monitor some CentOS 7.4 servers. Via the auto-deployment script through the "Add-Data" tab I tried to deploy the collection. This failed however, since the Splunk collectd plugin does not seem to recognize the libcurl library which resulted in error code 6, could resolve hostname although a regular curl works (adding a sample metric through HEC).
In the end I got around this by using the old method http_write plugin. So I have now the metrics in, but it does not seem to be working natively with the infrastructure app. When opening the server in the app (it is recognized in the investigate tab), then the metrics are empty in the overview sub-tab. When I click on analyze, it states the following: "You do not have permissions to access objects of user=x". The panels give the following text: "There is no data available for cpu.system. To see data on the chart, select a different time range, edit filters, or check with your administrator about user permissions."
This seems clearly like an rights issue, because the cpu.* metrics are actually there. I have however no clue what the Infrastructure app is expecting in terms of rights / users. As far as my knowledge goes, this is all default. I am sending the data to the default em_metrics index from the Infrastructure app with sourcetype collectd_http.
Does anybody have any idea why I get these permission messages and how I can fix this?
Best regards,
Mark
- Mark as New
- Bookmark Message
- Subscribe to Message
- Mute Message
- Subscribe to RSS Feed
- Permalink
- Report Inappropriate Content
Nobody has a clue?
- Mark as New
- Bookmark Message
- Subscribe to Message
- Mute Message
- Subscribe to RSS Feed
- Permalink
- Report Inappropriate Content
Do you have the roles granted to your user? There are new roles created by the Splunk app for Infrastructure app..
- Mark as New
- Bookmark Message
- Subscribe to Message
- Mute Message
- Subscribe to RSS Feed
- Permalink
- Report Inappropriate Content
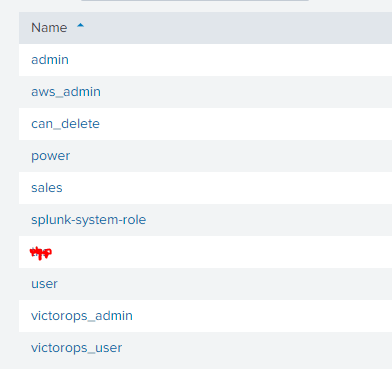
Hm, maybe these roles have not been created... I only see these and to me they seem the regular ones, except for aws_admin, sales and victor_ops.
- Mark as New
- Bookmark Message
- Subscribe to Message
- Mute Message
- Subscribe to RSS Feed
- Permalink
- Report Inappropriate Content
My apologies I'm getting my apps confused, no new roles exist for this app!
So the only thing I can think of is:
Is there any local files that override the default app settings?
i.e. in $SPLUNK_HOME/etc/apps/splunk_app_infrastructure/local
Is there anything that would override the default settings? And which Splunk version? I just tested in 7.3.3 and SAI 2.0.3
- Mark as New
- Bookmark Message
- Subscribe to Message
- Mute Message
- Subscribe to RSS Feed
- Permalink
- Report Inappropriate Content
No worries. I did not change anything in the configuration files of the SAI. When you test it, did you use the Splunk plugin for contentd or the http_write plugin?
Splunk App for Infrastructure Version 2.1.0 Build 20
- Mark as New
- Bookmark Message
- Subscribe to Message
- Mute Message
- Subscribe to RSS Feed
- Permalink
- Report Inappropriate Content
I have not tried 2.1.0, only the older 2.0.x, we used the collectd standard install with minimal changes...
- Mark as New
- Bookmark Message
- Subscribe to Message
- Mute Message
- Subscribe to RSS Feed
- Permalink
- Report Inappropriate Content
Also in combination with CentOS? If so, which version? Because in my case the Splunk collectd plugin reports it cannot resolve the hostname, even when it is just a regular IP and the SplunkForwarder can send log events to our Splunk.
- Mark as New
- Bookmark Message
- Subscribe to Message
- Mute Message
- Subscribe to RSS Feed
- Permalink
- Report Inappropriate Content
I believe it is an older Redhat 7.x
- Mark as New
- Bookmark Message
- Subscribe to Message
- Mute Message
- Subscribe to RSS Feed
- Permalink
- Report Inappropriate Content
Interesting, because I am trying to deploy it on a CentOS 7.6 & 7.4 version, so it should not differ much from that perspective.
Do you maybe have your deploy/installation commands?
- Mark as New
- Bookmark Message
- Subscribe to Message
- Mute Message
- Subscribe to RSS Feed
- Permalink
- Report Inappropriate Content
Sorry I did not keep them! They were mostly defaults with minor changes to what the SAI app provided, note that this was all in app 2.0.x not 2.1.x, I have not tested the newest version yet...

