- Find Answers
- :
- Splunk Platform
- :
- Splunk Enterprise
- :
- Search Head Cluster: Why is there "SHCMasterArtifa...
- Subscribe to RSS Feed
- Mark Topic as New
- Mark Topic as Read
- Float this Topic for Current User
- Bookmark Topic
- Subscribe to Topic
- Mute Topic
- Printer Friendly Page
- Mark as New
- Bookmark Message
- Subscribe to Message
- Mute Message
- Subscribe to RSS Feed
- Permalink
- Report Inappropriate Content
Hi everyone,
We are getting the following errors at our search head cluster after upgrade from version 7.2 to 8.0.7.
02-19-2021 09:16:47.624 +1300 ERROR SHCMasterArtifactHandler - failed on report target request aid=<user>__<user>__<app>__search7_1613679386.427489_48308674-xxxx-47E3-9082-xxxxxxx err='event=SHPMaster::addTarget aid=<user>__<user>__<app>__search7_1613679386.427489_48308674-xxxx-47E3-9082-xxxxxxxx not found'

02-19-2021 09:16:32.170 +1300 ERROR SHCMasterArtifactHandler - failed on report target request aid=<user>__<user>__<app>__RMD5e967e08868cc3c79_1613679388.427490_48308674-xxxx-47E3-9082-xxxxxxx err='event=SHPMaster::addTarget <user>__<user>__<app>__RMD5e967e08868cc3c79_1613679388.427490_48308674-xxxx-47E3-9082-xxxxxxx not found'

02-19-2021 09:16:32.171 +1300 ERROR SHCRepJob - failed job=SHPRepJob peer="xxx", guid="xxxxx" aid=<user>__<user>_TlpfUFJN__AlertsNow_1614294144.514899_E91XXXX-2563-4D2A-903BX-XXXXXXXX, tgtPeer="XXXXX", tgtGuid="XXXXXX", tgtRP=8091, useSSL=false tgt_hp=10.xx.xx.xx:8089 tgt_guid=XXXXX-E82E-47E3-9082-2AFC9B0XXXX err=uri=https://10.xx.xx.xx:8089/services/shcluster/member/artifacts/<user>__<user>_TlpfUFJN__AlertsNow_1614294144.514899_XXXX4-2563-4D2A-903B-DAF7XXXXX/replicate?output_mode=json, error=500 - Failed to trigger replication (artifact='<user>__<user>_TlpfUFJN__AlertsNow_1614294144.514899_XXXXX-2563-4D2A-903B-DAF743AXXXXX') (err='Replication match: aid=<user>__<user>_TlpfUFJN__AlertsNow_1614294144.514899_XXXX-2563-4D2A-903B-DAF7XXXX src=XXXX-2563-4D2A-903B-DAF743AXXXX target=XXXX8674-E82E-47E3-9082-2AFC9BXXXXX already exists!')

02-19-2021 09:16:32.271 +1300 INFO  SHCMaster - event=SHPMaster::handleReplicationSuccess aid=<user>__<user>_TlpfUFJN__AlertsNow_1614294144.514899_XXXX3D4-2563-4D2A-903B-DAF7XXX src=XXXX3D4-2563-4D2A-903B-DAF743A448FC tgt=XXXX674-E82E-47E3-9082-2AFC9XXXXX msg='target hasn't added this artifact yet, will ignore'
The errors seem to be benign, we don't find failed or skipped searches.
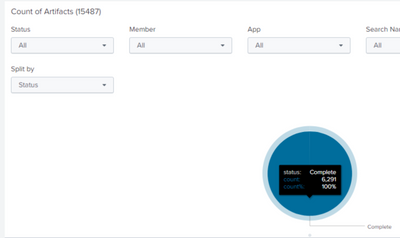
Count of Artifacts also showing 100% completed.
Could not find any similar issue at known bug of this version either.
Any idea what could be wrong in here
Cheers,
S
- Mark as New
- Bookmark Message
- Subscribe to Message
- Mute Message
- Subscribe to RSS Feed
- Permalink
- Report Inappropriate Content
Hi everyone,
We have talked to splunk support team. Seems it is a begin known issue, which could be safely ignore if you found the search job artifact are being replicated to other search head cluster member normally.
See below for the response from Splunk support:
I've checked the diag files, and it seems like this is hitting SPL-199416, SPL-198851.
Would you check if you see the error when you execute the following steps, please?
If you can see the results on another SH while seeing the error, this error message can be safely ignored.
--------
1. Run a job on an SH and note the SID
2. Go to another SH in the SHC and access the SID results (Activity -> Jobs)
3. Search the internal log for: ERROR SHCMasterHTTPProxy Low Level HTTP "/services/shcluster/captain/artifacts/"
--------
<Known Issues>
https://docs.splunk.com/Documentation/Splunk/8.0.7/ReleaseNotes/KnownIssues
--------
2021-01-14 SPL-199416, SPL-198851 Unexplained benign SHCMasterHTTPProxy Low Level HTTP Request failure (for artifact) Response Code 500 post 8.0.6 upgrade
--------
Thank you and best regards,
- Mark as New
- Bookmark Message
- Subscribe to Message
- Mute Message
- Subscribe to RSS Feed
- Permalink
- Report Inappropriate Content
I have the same issues at Splunk 8.1.6.
The above solution was already checked in my environments. Everything is okay. All artefacts were replicated very well.
But in parallel I checked, the above errors cause in-between many captain exchanges.
My general issue is, why I got many captain exchanges in my environments? in the last month, there were around 43-50 times.
If I checked the error time, they were exactly matched at the time, when the captain was exchanged.
My question is, how to solve above issues? and I don't want to see/have the above errors at my monitoring console.

