Turn on suggestions
Auto-suggest helps you quickly narrow down your search results by suggesting possible matches as you type.
Splunk Enterprise
×
Are you a member of the Splunk Community?
Sign in or Register with your Splunk account to get your questions answered, access valuable resources and connect with experts!
Turn on suggestions
Auto-suggest helps you quickly narrow down your search results by suggesting possible matches as you type.
- Find Answers
- :
- Splunk Platform
- :
- Splunk Enterprise
- :
- Re: Operation of the monitoring console in a distr...
Options
- Subscribe to RSS Feed
- Mark Topic as New
- Mark Topic as Read
- Float this Topic for Current User
- Bookmark Topic
- Subscribe to Topic
- Mute Topic
- Printer Friendly Page
- Mark as New
- Bookmark Message
- Subscribe to Message
- Mute Message
- Subscribe to RSS Feed
- Permalink
- Report Inappropriate Content
KwonTaeHoon
Path Finder
08-29-2023
09:53 AM
Hello
I upgraded from Splunk Enterprise 8.2.10 to 9.1.0.2.
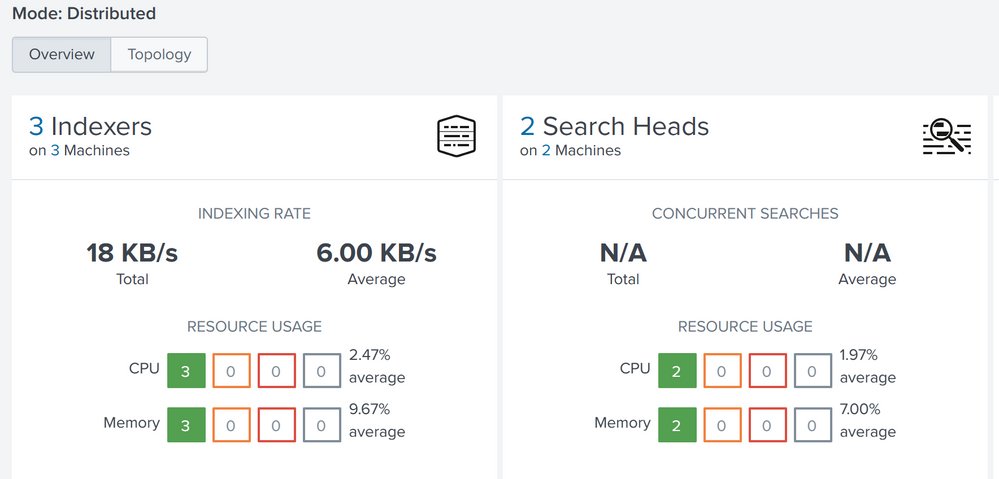
The values of the overview dashboard of the monitoring console are visible or not visible.
Is it a bug or is there a way to fix it?
I look forward to hearing from you.
1 Solution
- Mark as New
- Bookmark Message
- Subscribe to Message
- Mute Message
- Subscribe to RSS Feed
- Permalink
- Report Inappropriate Content
simenhaugen
Explorer
02-19-2024
05:32 AM
This issues was resolved in version 9.1.2:
- Mark as New
- Bookmark Message
- Subscribe to Message
- Mute Message
- Subscribe to RSS Feed
- Permalink
- Report Inappropriate Content
simenhaugen
Explorer
02-19-2024
05:32 AM
This issues was resolved in version 9.1.2:
- Mark as New
- Bookmark Message
- Subscribe to Message
- Mute Message
- Subscribe to RSS Feed
- Permalink
- Report Inappropriate Content
simenhaugen
Explorer
09-11-2023
05:17 AM
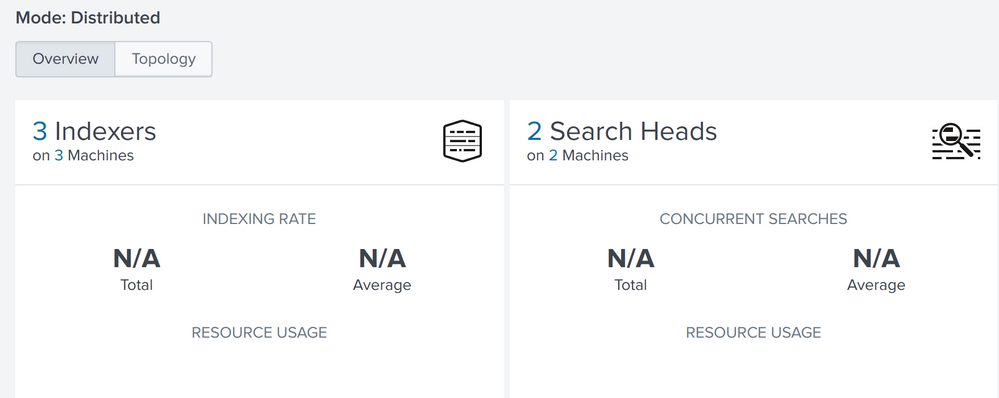
I am experiencing the exact same issue in our deployment after upgrading from 9.0.5 to 9.1.0.2.
Most of the visualisations fail to load, and "Indexing Rate" and "Concurrent Searches" only show "N/A".
The new "Splunk Assist" banner at the top of the Overview page also fails to load.
Get Updates on the Splunk Community!
Splunk + ThousandEyes: Correlate frontend, app, and network data to troubleshoot ...
Are you tired of troubleshooting delays caused by siloed frontend, application, and network data? We've got a ...
Splunk Observability for AI
Don’t miss out on an exciting Tech Talk on Splunk Observability for AI!Discover how Splunk’s agentic AI ...
🔐 Trust at Every Hop: How mTLS in Splunk Enterprise 10.0 Makes Security Simpler
From Idea to Implementation: Why Splunk Built mTLS into Splunk Enterprise 10.0
mTLS wasn’t just a checkbox ...


