Turn on suggestions
Auto-suggest helps you quickly narrow down your search results by suggesting possible matches as you type.
Splunk Enterprise
×
Are you a member of the Splunk Community?
Sign in or Register with your Splunk account to get your questions answered, access valuable resources and connect with experts!
Turn on suggestions
Auto-suggest helps you quickly narrow down your search results by suggesting possible matches as you type.
- Find Answers
- :
- Splunk Platform
- :
- Splunk Enterprise
- :
- Operation of the monitoring console in a distribut...
Options
- Subscribe to RSS Feed
- Mark Topic as New
- Mark Topic as Read
- Float this Topic for Current User
- Bookmark Topic
- Subscribe to Topic
- Mute Topic
- Printer Friendly Page
- Mark as New
- Bookmark Message
- Subscribe to Message
- Mute Message
- Subscribe to RSS Feed
- Permalink
- Report Inappropriate Content
KwonTaeHoon
Path Finder
08-29-2023
09:53 AM
Hello
I upgraded from Splunk Enterprise 8.2.10 to 9.1.0.2.
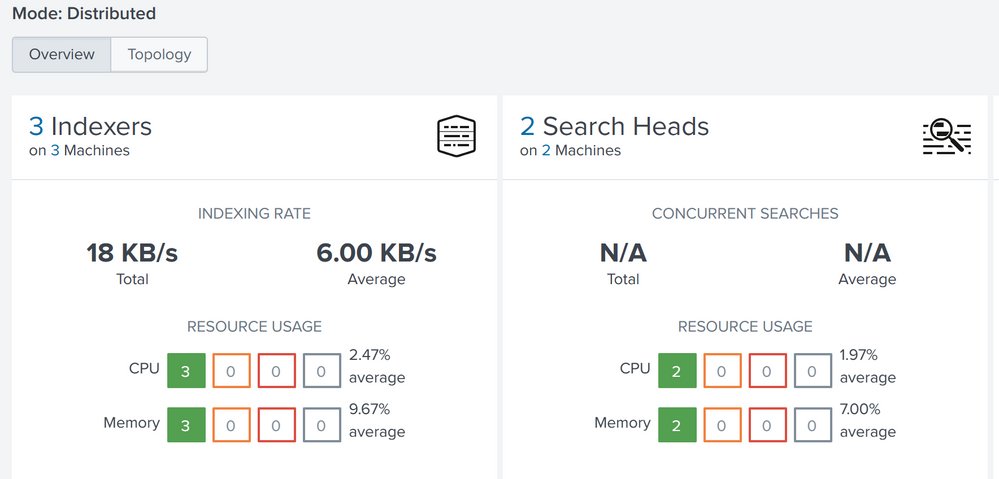
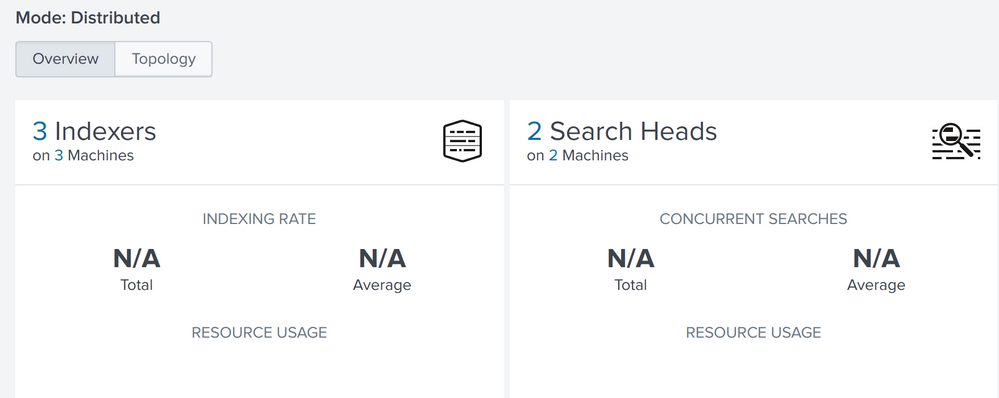
The values of the overview dashboard of the monitoring console are visible or not visible.
Is it a bug or is there a way to fix it?
I look forward to hearing from you.
1 Solution
- Mark as New
- Bookmark Message
- Subscribe to Message
- Mute Message
- Subscribe to RSS Feed
- Permalink
- Report Inappropriate Content
simenhaugen
Explorer
02-19-2024
05:32 AM
This issues was resolved in version 9.1.2:
- Mark as New
- Bookmark Message
- Subscribe to Message
- Mute Message
- Subscribe to RSS Feed
- Permalink
- Report Inappropriate Content
simenhaugen
Explorer
02-19-2024
05:32 AM
This issues was resolved in version 9.1.2:
- Mark as New
- Bookmark Message
- Subscribe to Message
- Mute Message
- Subscribe to RSS Feed
- Permalink
- Report Inappropriate Content
simenhaugen
Explorer
09-11-2023
05:17 AM
I am experiencing the exact same issue in our deployment after upgrading from 9.0.5 to 9.1.0.2.
Most of the visualisations fail to load, and "Indexing Rate" and "Concurrent Searches" only show "N/A".
The new "Splunk Assist" banner at the top of the Overview page also fails to load.
Career Survey
First 500 qualified respondents will receive a $20 gift card! Tell us about your professional Splunk journey.
Get Updates on the Splunk Community!
What Is Splunk? Here’s What You Can Do with Splunk
Hey Splunk Community, we know you know Splunk. You likely leverage its unparalleled ability to ingest, index, ...
Level Up Your .conf25: Splunk Arcade Comes to Boston
With .conf25 right around the corner in Boston, there’s a lot to look forward to — inspiring keynotes, ...
Manual Instrumentation with Splunk Observability Cloud: How to Instrument Frontend ...
Although it might seem daunting, as we’ve seen in this series, manual instrumentation can be straightforward ...


