Turn on suggestions
Auto-suggest helps you quickly narrow down your search results by suggesting possible matches as you type.
Showing results for
Splunk Enterprise
Turn on suggestions
Auto-suggest helps you quickly narrow down your search results by suggesting possible matches as you type.
Showing results for
- Splunk Answers
- :
- Splunk Platform Products
- :
- Splunk Enterprise
- :
- Operation of the monitoring console in a distribut...
Options
- Subscribe to RSS Feed
- Mark Topic as New
- Mark Topic as Read
- Float this Topic for Current User
- Bookmark Topic
- Subscribe to Topic
- Mute Topic
- Printer Friendly Page
- Mark as New
- Bookmark Message
- Subscribe to Message
- Mute Message
- Subscribe to RSS Feed
- Permalink
- Report Inappropriate Content
KwonTaeHoon
Path Finder
08-29-2023
09:53 AM
Hello
I upgraded from Splunk Enterprise 8.2.10 to 9.1.0.2.
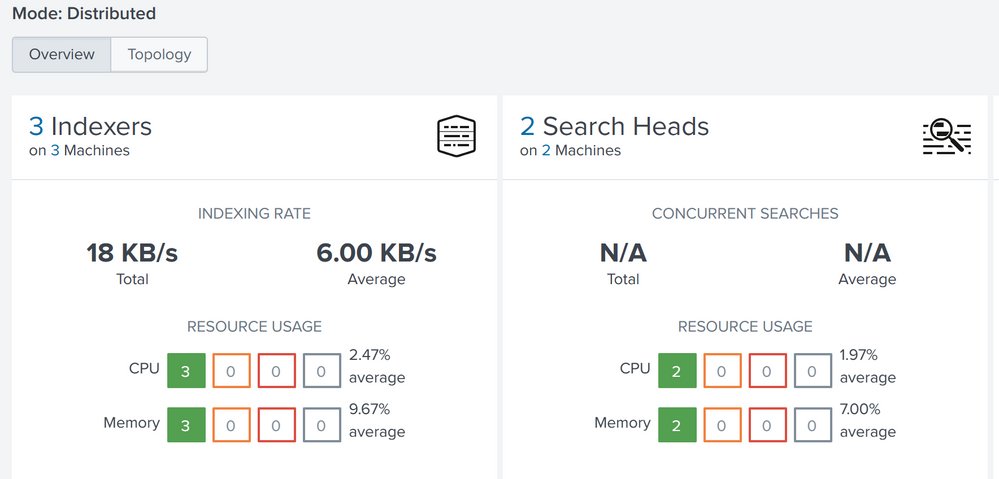
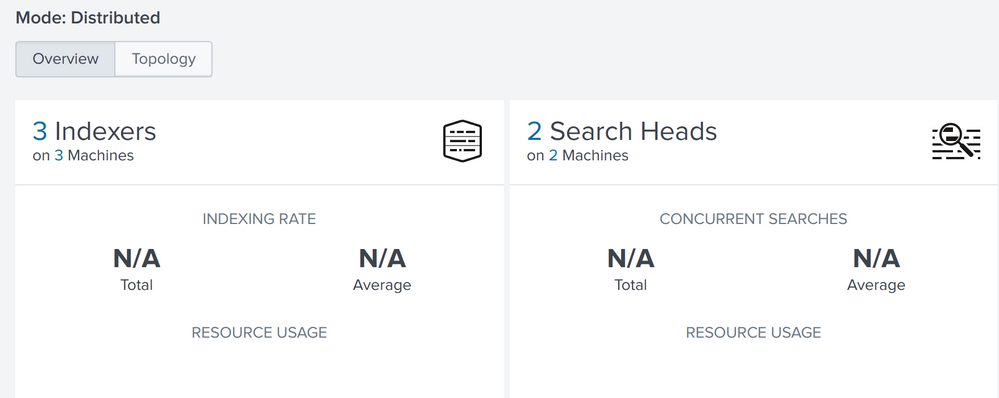
The values of the overview dashboard of the monitoring console are visible or not visible.
Is it a bug or is there a way to fix it?
I look forward to hearing from you.
1 Solution
- Mark as New
- Bookmark Message
- Subscribe to Message
- Mute Message
- Subscribe to RSS Feed
- Permalink
- Report Inappropriate Content
simenhaugen
Explorer
02-19-2024
05:32 AM
This issues was resolved in version 9.1.2:
- Mark as New
- Bookmark Message
- Subscribe to Message
- Mute Message
- Subscribe to RSS Feed
- Permalink
- Report Inappropriate Content
simenhaugen
Explorer
02-19-2024
05:32 AM
This issues was resolved in version 9.1.2:
- Mark as New
- Bookmark Message
- Subscribe to Message
- Mute Message
- Subscribe to RSS Feed
- Permalink
- Report Inappropriate Content
simenhaugen
Explorer
09-11-2023
05:17 AM
I am experiencing the exact same issue in our deployment after upgrading from 9.0.5 to 9.1.0.2.
Most of the visualisations fail to load, and "Indexing Rate" and "Concurrent Searches" only show "N/A".
The new "Splunk Assist" banner at the top of the Overview page also fails to load.
Get Updates on the Splunk Community!
.conf24 | Day 0
Hello Splunk Community!
My name is Chris, and I'm based in Canberra, Australia's capital, and I travelled for ...
Enhance Security Visibility with Splunk Enterprise Security 7.1 through Threat ...
(view in My Videos)Struggling with alert fatigue, lack of context, and prioritization around security ...
Troubleshooting the OpenTelemetry Collector
In this tech talk, you’ll learn how to troubleshoot the OpenTelemetry collector - from checking the ...


