Turn on suggestions
Auto-suggest helps you quickly narrow down your search results by suggesting possible matches as you type.
Showing results for
Splunk Enterprise
Turn on suggestions
Auto-suggest helps you quickly narrow down your search results by suggesting possible matches as you type.
Showing results for
- Splunk Answers
- :
- Splunk Platform Products
- :
- Splunk Enterprise
- :
- Operation of the monitoring console in a distribut...
Options
- Subscribe to RSS Feed
- Mark Topic as New
- Mark Topic as Read
- Float this Topic for Current User
- Bookmark Topic
- Subscribe to Topic
- Mute Topic
- Printer Friendly Page
- Mark as New
- Bookmark Message
- Subscribe to Message
- Mute Message
- Subscribe to RSS Feed
- Permalink
- Report Inappropriate Content
KwonTaeHoon
Path Finder
08-29-2023
09:53 AM
Hello
I upgraded from Splunk Enterprise 8.2.10 to 9.1.0.2.
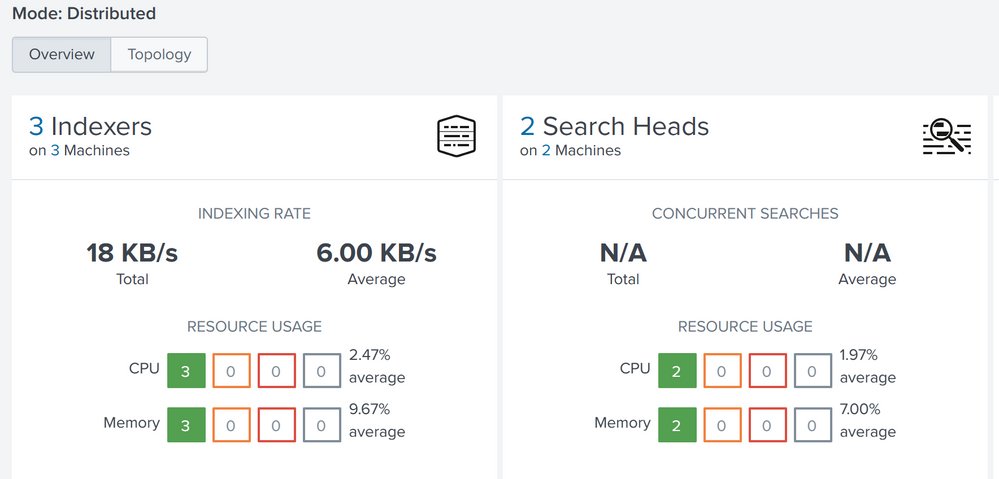
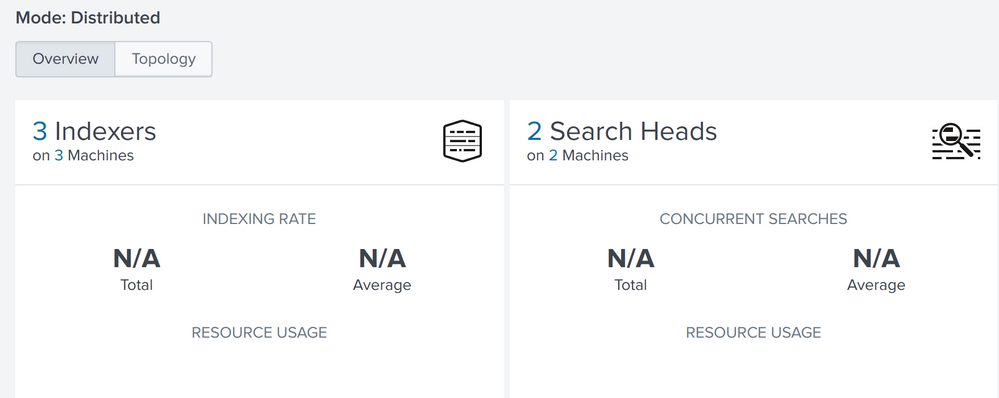
The values of the overview dashboard of the monitoring console are visible or not visible.
Is it a bug or is there a way to fix it?
I look forward to hearing from you.
1 Solution
- Mark as New
- Bookmark Message
- Subscribe to Message
- Mute Message
- Subscribe to RSS Feed
- Permalink
- Report Inappropriate Content
simenhaugen
Explorer
02-19-2024
05:32 AM
This issues was resolved in version 9.1.2:
- Mark as New
- Bookmark Message
- Subscribe to Message
- Mute Message
- Subscribe to RSS Feed
- Permalink
- Report Inappropriate Content
simenhaugen
Explorer
02-19-2024
05:32 AM
This issues was resolved in version 9.1.2:
- Mark as New
- Bookmark Message
- Subscribe to Message
- Mute Message
- Subscribe to RSS Feed
- Permalink
- Report Inappropriate Content
simenhaugen
Explorer
09-11-2023
05:17 AM
I am experiencing the exact same issue in our deployment after upgrading from 9.0.5 to 9.1.0.2.
Most of the visualisations fail to load, and "Indexing Rate" and "Concurrent Searches" only show "N/A".
The new "Splunk Assist" banner at the top of the Overview page also fails to load.
Get Updates on the Splunk Community!
Everything Community at .conf24!
You may have seen mention of the .conf Community Zone 'round these parts and found yourself wondering what ...
Index This | I’m short for "configuration file.” What am I?
May 2024 Edition
Hayyy Splunk Education Enthusiasts and the Eternally Curious!
We’re back with a Special ...
New Articles from Academic Learning Partners, Help Expand Lantern’s Use Case Library, ...
Splunk Lantern is a Splunk customer success center that provides advice from Splunk experts on valuable data ...


