- Find Answers
- :
- Splunk Platform
- :
- Splunk Enterprise
- :
- How to resolve crash events in windows application...
- Subscribe to RSS Feed
- Mark Topic as New
- Mark Topic as Read
- Float this Topic for Current User
- Bookmark Topic
- Subscribe to Topic
- Mute Topic
- Printer Friendly Page
- Mark as New
- Bookmark Message
- Subscribe to Message
- Mute Message
- Subscribe to RSS Feed
- Permalink
- Report Inappropriate Content
How to resolve crash events in windows application log for App: splunk-winevtlog.exe (eventcode = 1000)?
I'm having som issues with the application log on some of our windows servers getting spammed with the following messages:
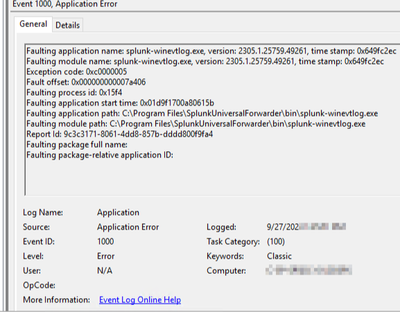
Faulting application name: splunk-winevtlog.exe, version: 1794.768.23581.39240, time stamp: 0x5c1d9d74
Faulting module name: KERNELBASE.dll, version: 6.3.9600.19724, time stamp: 0x5ec5262a
Exception code: 0xeeab5254
Fault offset: 0x0000000000007afc
Faulting process id: 0x3258
Faulting application start time: 0x01d787a1d9f141cd
Faulting application path: C:\Program Files\SplunkUniversalForwarder\bin\splunk-winevtlog.exe
Faulting module path: C:\Windows\system32\KERNELBASE.dll
Report Id: 18687572-f395-11eb-8131-005056b32672
Faulting package full name:
Faulting package-relative application ID:
Always followed by a 1001 information event like so:
Fault bucket , type 0
Event Name: APPCRASH
Response: Not available
Cab Id: 0

Problem signature:
P1: splunk-winevtlog.exe
P2: 1794.768.23581.39240
P3: 5c1d9d74
P4: KERNELBASE.dll
P5: 6.3.9600.19724
P6: 5ec5262a
P7: eeab5254
P8: 0000000000007afc
P9:
P10:

Attached files:

These files may be available here:
C:\ProgramData\Microsoft\Windows\WER\ReportQueue\AppCrash_splunk-winevtlog_32b957db7bcb27fbdcdd5be64aea86e1b639666_0170a0ed_a993dd7e

Analysis symbol:
Rechecking for solution: 0
Report Id: 18687572-f395-11eb-8131-005056b32672
Report Status: 4100
Hashed bucket:
I've tried a lot of changes to the Universal Forwarder configuration but nothing i do removes these message. The only thing i've noticed that can helt to remove these messages is by lowering the memory consumption on the server. So far the servers i've seen with these message in the application log are running at 70% and more memory consumption. But 70% memory consumption seems to be normal and i don't see why this should cause the splunk-winevtlog.exe to crash (as often as every minute).
Our version of Splunk Universal Forwarder is 7.2.3. I've checked the "known issues" on splunk docs but can't fint anything related to memory issues for this version.
I'm thinking about upgrading the Universal Forwarder to a newer version, but that's just because i can't think og anything else to try. Do anyone else experience this and know what can be done?
As a side note: Splunk internal shows absolutely nothing. There are no warnings or errors at all in the internal log on these servers. But the event spamming (crashes) are still logged in the windows application log. Splunk itself does not log or detect a crash it seems?
- Mark as New
- Bookmark Message
- Subscribe to Message
- Mute Message
- Subscribe to RSS Feed
- Permalink
- Report Inappropriate Content
For the protocol, version 9.2.2 doesn't help either.
- Mark as New
- Bookmark Message
- Subscribe to Message
- Mute Message
- Subscribe to RSS Feed
- Permalink
- Report Inappropriate Content
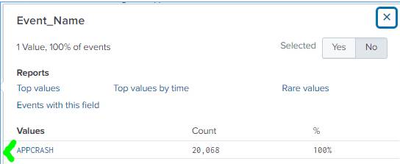
We're getting hammered by these. 20k in 24 hours. 🙂
- Mark as New
- Bookmark Message
- Subscribe to Message
- Mute Message
- Subscribe to RSS Feed
- Permalink
- Report Inappropriate Content
- Mark as New
- Bookmark Message
- Subscribe to Message
- Mute Message
- Subscribe to RSS Feed
- Permalink
- Report Inappropriate Content
We are having same issue, wierd is that it isn't affecting all servers, just one so far, and we are using the exact same installer, all our servers are built the same...
- Mark as New
- Bookmark Message
- Subscribe to Message
- Mute Message
- Subscribe to RSS Feed
- Permalink
- Report Inappropriate Content
Hi ! We're having similar issue as well, with splunk-winevtlog and splunk-perfmon being the culprits, but Signature P4 is not KERNELBASE but the splunk process itself. It only affects Server 2019. Bursts of AppCrash show up every 5 minutes or so.
We've tried version 9.0.6 and 9.1.1
We opened a support case, turned on DEBUG logging and sent them diags, etc .. the works ..
What we've found was that, clearing the WER folder of AppCrash files C:\ProgramData\Microsoft\Windows\WER ( Settings > Storage > Free Space > Windows Error Report - check delete Files ) .. would cease the issue on that single server .. at least until the issue gets triggered again.
Did you get your issue fixed with release version 9.0.6 @PeterBoard ? Thanks
- Mark as New
- Bookmark Message
- Subscribe to Message
- Mute Message
- Subscribe to RSS Feed
- Permalink
- Report Inappropriate Content
So, the result of our troubleshoot, was that all of the hundreds of crash events we were seeing related to winevtlog or perfmon, were not crashes happening but re-attempts of sending past crashes to Microsoft, and failing, because these were on an air-gaped subset of the estate. The clue was, apart from ceasing the activity by clearing all the WER folder, that Report_Id just kept repeating ...
sourcetype="WinEventLog:Application" AppCrash | regex Message=".*(?<splunk>splunk[-\w]+)" | timechart span=30m dc(Report_Id)This search showed a constant value of 12 across several days
Then we found there is a GPO that tells servers to log AppCrash events, but not send them to Microsoft
- Mark as New
- Bookmark Message
- Subscribe to Message
- Mute Message
- Subscribe to RSS Feed
- Permalink
- Report Inappropriate Content
Yes, our issue with the splunk-winevtlog.exe process crashing on capturing data from the Security Log was resolved. I haven't looked for the bug you mentioned
- Mark as New
- Bookmark Message
- Subscribe to Message
- Mute Message
- Subscribe to RSS Feed
- Permalink
- Report Inappropriate Content
Hi Peter,
how has it been solved and when?
Thanks!
Alessandro
- Mark as New
- Bookmark Message
- Subscribe to Message
- Mute Message
- Subscribe to RSS Feed
- Permalink
- Report Inappropriate Content
Hi Alex,
Yes this issue was resolved for us with the 9.1.1 release (we originally tested with Splunk a 9.0.6 debug build that also had the fix, so 9.0.6 should also be fine). We are no longer experiencing the issue.
Peter
- Mark as New
- Bookmark Message
- Subscribe to Message
- Mute Message
- Subscribe to RSS Feed
- Permalink
- Report Inappropriate Content
Also experiencing this issue a lot with the splunk-eventlog.exe crashing, some hosts on 9.0.5 and some on 9.0.4
- Mark as New
- Bookmark Message
- Subscribe to Message
- Mute Message
- Subscribe to RSS Feed
- Permalink
- Report Inappropriate Content
On further investigation - it seems like its only happening on 9.0.5 - some clients with 9.0.4 had a few random new servers running 9.0.5 - and its these servers that we are seeing the Splunk UF process crashing regularly for splunk-winevtlog.exe.
We are logging a support case with Splunk for the issue - it's only happening on servers that have been upgraded to the 9.0.5 Splunk UF for us
- Mark as New
- Bookmark Message
- Subscribe to Message
- Mute Message
- Subscribe to RSS Feed
- Permalink
- Report Inappropriate Content
Same on 9.0.5.0
- Mark as New
- Bookmark Message
- Subscribe to Message
- Mute Message
- Subscribe to RSS Feed
- Permalink
- Report Inappropriate Content
We already observed that behavior in multiple previous Splunk Universal Forwarder versions such as 7.3.3, 8.1.3, ... and it still occurs with version 9.0.4 as well (Faulting application name: splunk-winevtlog.exe).
Servers with high event count generate more often AppCrash events (Event IDs 1000/1001) than servers with low event count.
- Mark as New
- Bookmark Message
- Subscribe to Message
- Mute Message
- Subscribe to RSS Feed
- Permalink
- Report Inappropriate Content
@mykol_j - It could be very likely permission issue on Windows. Try with any other test instance, run Splunk with previledged user.
If nothing works, you can create Support ticket.
I hope this helps!!!
- Mark as New
- Bookmark Message
- Subscribe to Message
- Mute Message
- Subscribe to RSS Feed
- Permalink
- Report Inappropriate Content
Good point. I'm afraid if that works, it's still not a fix as we can't run processes with elevated privs... I'll still see about testing it though.
- Mark as New
- Bookmark Message
- Subscribe to Message
- Mute Message
- Subscribe to RSS Feed
- Permalink
- Report Inappropriate Content
wow, almost two years and now answer?
I'm getting this too, on about 383 different UF clients (out of about a1,000).
I'm using the latest 9.0.4.0...
- Mark as New
- Bookmark Message
- Subscribe to Message
- Mute Message
- Subscribe to RSS Feed
- Permalink
- Report Inappropriate Content
Having the same problem as well. I could break it down to the 4624 events. splunk-winevtlog.exe crashes only if a lot of 4624 events are generated. For example on my DC I got the crash's regularly until I excluded the 4624 id. Splunk please fix this.
- Mark as New
- Bookmark Message
- Subscribe to Message
- Mute Message
- Subscribe to RSS Feed
- Permalink
- Report Inappropriate Content
Splunk Support have confirmed this bug with a Case we have opened, they have supplied a Debug / Test Splunk UF 9.0.6 build that has the bug fixed.
We are waiting for the release version of 9.0.6 or 9.1.0.2 (or something like that) with the fix
- Mark as New
- Bookmark Message
- Subscribe to Message
- Mute Message
- Subscribe to RSS Feed
- Permalink
- Report Inappropriate Content
Hi,
any news on that? I actually had the same problem with 9.0.4. Tried with 9.0.6 and 9.1.1 with no luck. It seems to happen when trying to read "Forwarded Events" events, if limited by inputs to read "Security Events" works without issues.
Regards
Alex
- Mark as New
- Bookmark Message
- Subscribe to Message
- Mute Message
- Subscribe to RSS Feed
- Permalink
- Report Inappropriate Content
I'm seeing the same issue. Updated to 9.0.5 and was seeing a server 2019 host fill up with these events. Updated to 9.0.6 and still seeing the issue on that host.


