Are you a member of the Splunk Community?
- Find Answers
- :
- Splunk Platform
- :
- Splunk Enterprise
- :
- Can I Pass Values to Single Value Panel?
- Subscribe to RSS Feed
- Mark Topic as New
- Mark Topic as Read
- Float this Topic for Current User
- Bookmark Topic
- Subscribe to Topic
- Mute Topic
- Printer Friendly Page
- Mark as New
- Bookmark Message
- Subscribe to Message
- Mute Message
- Subscribe to RSS Feed
- Permalink
- Report Inappropriate Content
Hello All,
I'm new to Splunk. I have the below table. I want to show the Previous Month Actual Cost in a single value panel, and the difference as a subscript and trend showing it is increased or decreased comparing to Current Month Forecast Cost
How can I structure the Simple XML to get the desired output?
- Mark as New
- Bookmark Message
- Subscribe to Message
- Mute Message
- Subscribe to RSS Feed
- Permalink
- Report Inappropriate Content
Ah, okay.
Please test below search query. The lookup must contain a timestamp of the forecasted month that is used by the timechart.
index=azure_cost_management earliest=-6mon@mon latest=@mon
|append [
| inputlookup MyAzureSubscription-forecast_cost.csv
| rename Cost AS CostInBillingCurrency
| eval _time=strptime(UsageDate,"%Y%m%d")
]
 | timechart span=1month sum(CostInBillingCurrency) by SubscriptionName
- Mark as New
- Bookmark Message
- Subscribe to Message
- Mute Message
- Subscribe to RSS Feed
- Permalink
- Report Inappropriate Content
@josephjohn2211 Please provide your current search
- Mark as New
- Bookmark Message
- Subscribe to Message
- Mute Message
- Subscribe to RSS Feed
- Permalink
- Report Inappropriate Content
"index=azure_cost_management earliest=-1mon@mon latest=@mon
| eventstats sum(CostInBillingCurrency) as PreviousMonthActualCost
| head 1
| table PreviousMonthActualCost, SubscriptionName
| join type=inner SubscriptionName
[| inputlookup MyAzureSubscription-forecast_cost.csv
| stats sum(Cost) as CurrentMonthForecastCost by SubscriptionName
| table CurrentMonthForecastCost, SubscriptionName]
| eval Difference=PreviousMonthActualCost - CurrentMonthForecastCost
| table PreviousMonthActualCost, CurrentMonthForecastCost, Difference,SubscriptionName"
Here Actual Cost and Forecast Cost are retrieved using Different APIs from Azure Cost Management
- Mark as New
- Bookmark Message
- Subscribe to Message
- Mute Message
- Subscribe to RSS Feed
- Permalink
- Report Inappropriate Content
Following search would be the easiest solution but based on your data retention policies and amount of events it may make sense to use a summary index or a lookup as you already do it.
index=azure_cost_management earliest=-6mon@mon latest=@mon
 | timechart span=1month sum(CostInBillingCurrency) by SubscriptionName
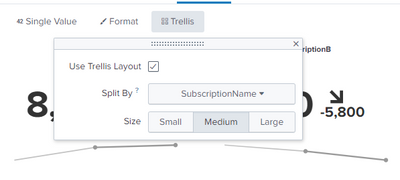
To split by SubscriptionName use Trellis as described here: Use trellis layout to split visualizations - Splunk Documentation
- Mark as New
- Bookmark Message
- Subscribe to Message
- Mute Message
- Subscribe to RSS Feed
- Permalink
- Report Inappropriate Content
The above query helps, but it compares the actual cost of Current Month with Previous Month. I wanted to compare the actual cost of Previous Month and Forecasted Cost of Current Month. Here Actual Cost Data is retrieved from the index and forecasted cost is retrieved from the lookup. Any suggestions on how can I edit the query to get the desired output
- Mark as New
- Bookmark Message
- Subscribe to Message
- Mute Message
- Subscribe to RSS Feed
- Permalink
- Report Inappropriate Content
Ah, okay.
Please test below search query. The lookup must contain a timestamp of the forecasted month that is used by the timechart.
index=azure_cost_management earliest=-6mon@mon latest=@mon
|append [
| inputlookup MyAzureSubscription-forecast_cost.csv
| rename Cost AS CostInBillingCurrency
| eval _time=strptime(UsageDate,"%Y%m%d")
]
 | timechart span=1month sum(CostInBillingCurrency) by SubscriptionName
- Mark as New
- Bookmark Message
- Subscribe to Message
- Mute Message
- Subscribe to RSS Feed
- Permalink
- Report Inappropriate Content
The above query is not working as expected. My Lookup Looks Like this and in my index the Date field is in ("%m/%d/%Y" - 02/01/2023). The _time uses the filed Date during indexing
- Mark as New
- Bookmark Message
- Subscribe to Message
- Mute Message
- Subscribe to RSS Feed
- Permalink
- Report Inappropriate Content
I edited my previous post and added strptime command. Please check it again.
- Mark as New
- Bookmark Message
- Subscribe to Message
- Mute Message
- Subscribe to RSS Feed
- Permalink
- Report Inappropriate Content
Thanks Paul. It works. I truly appreciate your help. Is there any way to show the former value instead of the later one in the visualization


