Turn on suggestions
Auto-suggest helps you quickly narrow down your search results by suggesting possible matches as you type.
Showing results for
Splunk Enterprise Security
Turn on suggestions
Auto-suggest helps you quickly narrow down your search results by suggesting possible matches as you type.
Showing results for
- Find Answers
- :
- Premium Solutions
- :
- Splunk Enterprise Security
- :
- Splunk Enterprise Security: If an analyst added a ...
Options
- Subscribe to RSS Feed
- Mark Topic as New
- Mark Topic as Read
- Float this Topic for Current User
- Bookmark Topic
- Subscribe to Topic
- Mute Topic
- Printer Friendly Page
- Mark as New
- Bookmark Message
- Subscribe to Message
- Mute Message
- Subscribe to RSS Feed
- Permalink
- Report Inappropriate Content
panovattack
Communicator
01-26-2016
12:07 PM
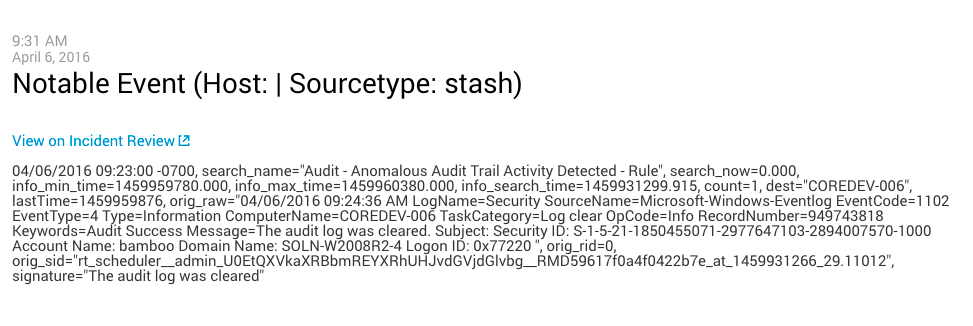
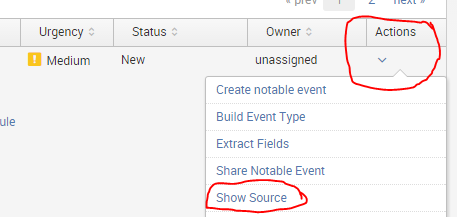
If an analyst has added a notable event to an investigation, how does another analyst open that notable event to review it? There does not seem to be an option to view the raw event referenced in the timeline or jump to the all the notable events for an investigation. The same goes for Splunk Events.
1 Solution
- Mark as New
- Bookmark Message
- Subscribe to Message
- Mute Message
- Subscribe to RSS Feed
- Permalink
- Report Inappropriate Content
panovattack
Communicator
02-26-2017
06:48 AM
- Mark as New
- Bookmark Message
- Subscribe to Message
- Mute Message
- Subscribe to RSS Feed
- Permalink
- Report Inappropriate Content
panovattack
Communicator
02-26-2017
06:48 AM
I believe this was fixed in updates to ES.
- Mark as New
- Bookmark Message
- Subscribe to Message
- Mute Message
- Subscribe to RSS Feed
- Permalink
- Report Inappropriate Content
smoir_splunk

Splunk Employee
04-06-2016
10:08 AM
- Mark as New
- Bookmark Message
- Subscribe to Message
- Mute Message
- Subscribe to RSS Feed
- Permalink
- Report Inappropriate Content
smoir_splunk

Splunk Employee
02-03-2016
03:44 PM
There is no way to do that in the latest version, unfortunately. You can view only notable events or splunk events on an investigation by filtering on a type: of notable event or splunk event.
In the latest release, however, there is no way to click through to the raw events from the investigation timeline.
- Mark as New
- Bookmark Message
- Subscribe to Message
- Mute Message
- Subscribe to RSS Feed
- Permalink
- Report Inappropriate Content
AndySplunks
Communicator
01-27-2016
10:06 AM
Get Updates on the Splunk Community!
Now Available: Cisco Talos Threat Intelligence Integrations for Splunk Security Cloud ...
At .conf24, we shared that we were in the process of integrating Cisco Talos threat intelligence into Splunk ...
Preparing your Splunk Environment for OpenSSL3
The Splunk platform will transition to OpenSSL version 3 in a future release. Actions are required to prepare ...
Easily Improve Agent Saturation with the Splunk Add-on for OpenTelemetry Collector
Agent Saturation What and Whys
In application performance monitoring, saturation is defined as the total load ...


