- Mark as New
- Bookmark Message
- Subscribe to Message
- Mute Message
- Subscribe to RSS Feed
- Permalink
- Report Inappropriate Content
Splunk Enterprise Security Correlation Searches resources consumption
Hello Splunk community! I have started my journey with splunk one month ago and I am currently learning Splunk Enterprise Security.
I have a very specific question, I am planning to use about 10-15 correlation searches in my ES and I would like to know if I need to upscale my resources for my Splunk machine, which is ubuntu server 20.04 with 32 GB RAM, 32 vCPU, and 200 GB hard disk.
I am have all-in-one installation scenario because I am just learning the basics of Splunk at the moment, but I would like to know:
How much resources do correlation searches in Splunk consume? How much RAM and CPU separately does one average correlation search consume in Splunk Enterprise Security?
- Mark as New
- Bookmark Message
- Subscribe to Message
- Mute Message
- Subscribe to RSS Feed
- Permalink
- Report Inappropriate Content
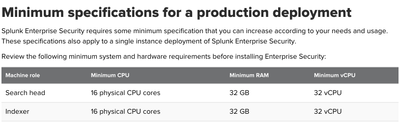
Hello @splunky_diamond, As stated by 2 folks, resource consumption depends on multiple factors. If you are planning to enable ~15 use cases in ES for learning purpose with all-in-one test environment, 32 GB RAM, 32 vCPU, and 200 GB hard disk should be enough.
Base configuration for ES is as below -
https://docs.splunk.com/Documentation/ES/7.3.1/Install/DeploymentPlanning
- Mark as New
- Bookmark Message
- Subscribe to Message
- Mute Message
- Subscribe to RSS Feed
- Permalink
- Report Inappropriate Content
As @deepakc already mentioned, there are many factors for sizing _any_ Splunk installation, not even going into ES. And with ES even more so.
With ES there is much going on "under the hood" even before you enable any correlation searches (manging notables, updating threat intel, updating assets database and so on). Of course for any reasonabe use cases you also need decently configured data (you _will_ want those datamodels accelerated so you will use resources for summary-building searches).
And on top of that - there are so many ways you can build a search (any search, not just correlation search in ES) wrong. I've seen several installations of Splunk and ES completely killed with very badly written searches which would be "easily' fixed by rewriting those searches properly.
A simple case - I've seen a search written by a team which would not ask their Splunk admins for extracting a field from a sourcetype. So they manually extracted the field from the events each time in their search.
Instead of simply writing, for example
index=whatever user IN (admin1, admin2, another_admin)
which - in a typical case limits the set of processed events pretty good at the start of your search they had to do
index=whatever
| rex "user: (?<user>\S+)"
| search user IN (admin1, admin2, another_admin)
Which meant that Splunk had to check for the field through every single event from the given search time range. That was a huge performance hit.
That's of course just one of the examples, there are many more antipatterns that you can break your searches with 😉
- Mark as New
- Bookmark Message
- Subscribe to Message
- Mute Message
- Subscribe to RSS Feed
- Permalink
- Report Inappropriate Content
Sizing Splunk for ES use has many factors for performance and to consider, it’s not a one size fits all.
As everything is a search, you need to have sufficient resources to cater for users and various aspects of the Splunk environment alongside the ES functions.
We go by a rule of thumb for ES sizing 100GB Per indexer, I have seen this higher in some cases (so the amount you’re ingesting per day), so try to understand much volume of data ingest comes into you Splunk per day.
We typically dedicate the ES SH on its own for large environments, the reason is when data comes in Splunk it will also be placing that data to disk, being a provider of that data, searching the data, running datamodel searches for the correlations rules and there will be dashboards. On top of this you may have other users using the ES or ad-hoc searches - so you can see many aspects to consider (CPU/RAM/IO/Network), otherwise it can become slow and you don’t want that, you need results in a timely fashion.
As guide its best for minimum for 16CPU/32G RAM for indexers and SH - as you have 32CPU/32RAM you should be ok as a starting point, but that does depend on the workload. You also need to check that the disk is SSD and I/Ops is over 800 and ensure you are not sending large volumes of data per day so that your AIO AIO can’t handle all the functions - so keep a check on ingest per day.
How to check for Correlation Searches resources consumption?
I would start to use the monitoring console(MC) for the usage stats, it’s very comprehensive, it will show the load etc, you can see which searches are consuming memory and this will help you with some aspects of resources.the MC comes with Splunk so it should be on your AIO. - see my links below for refence.
Some tips:
Ensure you only ingest important data sources on boarded and they are CIM Complaint via the TA's
Enable a few data models at time based on your use cases (Correlation rules you want to use) and keep monitoring via the MC checking the load overtime, this will help you keep on top of the resources.
Here ‘s some further links on the topics I have mentioned that you should read.
ES Performance Reference
https://docs.splunk.com/Documentation/ES/7.3.1/Install/DeploymentPlanning
MC Reference
https://docs.splunk.com/Documentation/Splunk/9.2.1/DMC/DMCoverview
Hardware Ref
https://docs.splunk.com/Documentation/Splunk/latest/Capacity/Referencehardware

