- Find Answers
- :
- Premium Solutions
- :
- Splunk Enterprise Security
- :
- How do I get Solarwinds data into Splunk with Sysl...
- Subscribe to RSS Feed
- Mark Topic as New
- Mark Topic as Read
- Float this Topic for Current User
- Bookmark Topic
- Subscribe to Topic
- Mute Topic
- Printer Friendly Page
- Mark as New
- Bookmark Message
- Subscribe to Message
- Mute Message
- Subscribe to RSS Feed
- Permalink
- Report Inappropriate Content
I would like retrieve data from Solarwinds when events trigger via Syslog. I know you can use the Solarwinds Splunk App but I would like to use Syslog instead.
- Mark as New
- Bookmark Message
- Subscribe to Message
- Mute Message
- Subscribe to RSS Feed
- Permalink
- Report Inappropriate Content
Best and easiest path -
1) Build a syslog server (I suggest syslog-ng). Instructions abound on the internet for this. For this purpose, it shouldn't have to be huge - a smallish linux VM would be fine.
2) Make solarwinds do syslog, sending it to that server. (If SW can't syslog, this is a problem we can't fix).
3) Then install the Splunk universal forwarder on that machine, have it read/parse the files and send them in.
4) (and more steps mostly not specific to this task, but important, like don't forget to logrotate them and so on.)
Happy Splunking!
-Rich
- Mark as New
- Bookmark Message
- Subscribe to Message
- Mute Message
- Subscribe to RSS Feed
- Permalink
- Report Inappropriate Content
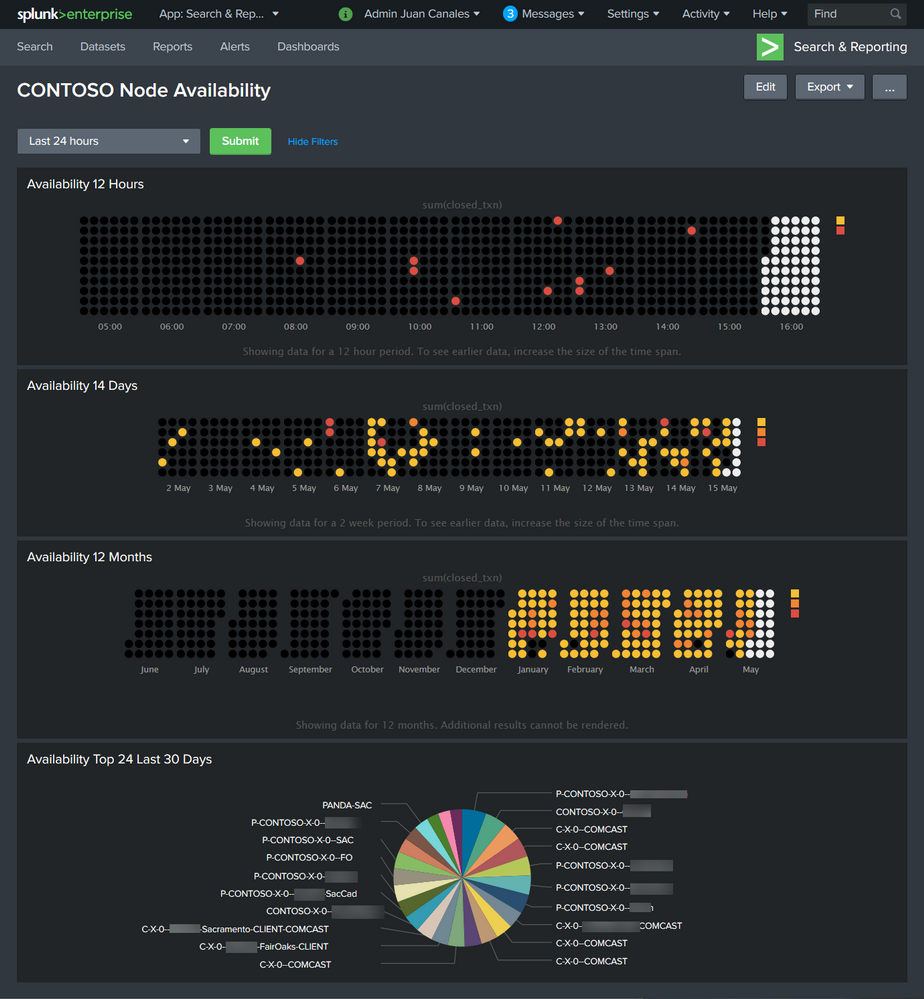
Thank you all for your advice, I was able to find a way to get data from SolarWinds into Splunk. I’m using a Syslog event in a Node Down Trigger. I created a Device Availability Dashboard by using Splunk.
Here is the example CONTOSO Node Availability Dashboard :

Step 1) You will need to have Solarwinds NPM installed.
Step 2) You will need to have Splunk installed.
Step 2.1) Install the Splunk calendar heat map.
Step 2.2) Create a new dashboard and call it "Contoso Node Availability". Select Edit Dashboard. Select Source. Copy and paste XML code attached. Select save dashboard.
Step 3) Configure your Splunk with a custom index. I call this index "Solarwinds". I created a syslog data input with a TCP port 532. You can use your port such as default syslog 514 UDP.
Step 4) Enabled your "Node is down" Alert in Solarwinds NPM Orion. You can do this by going to "Manage Alerts" section.
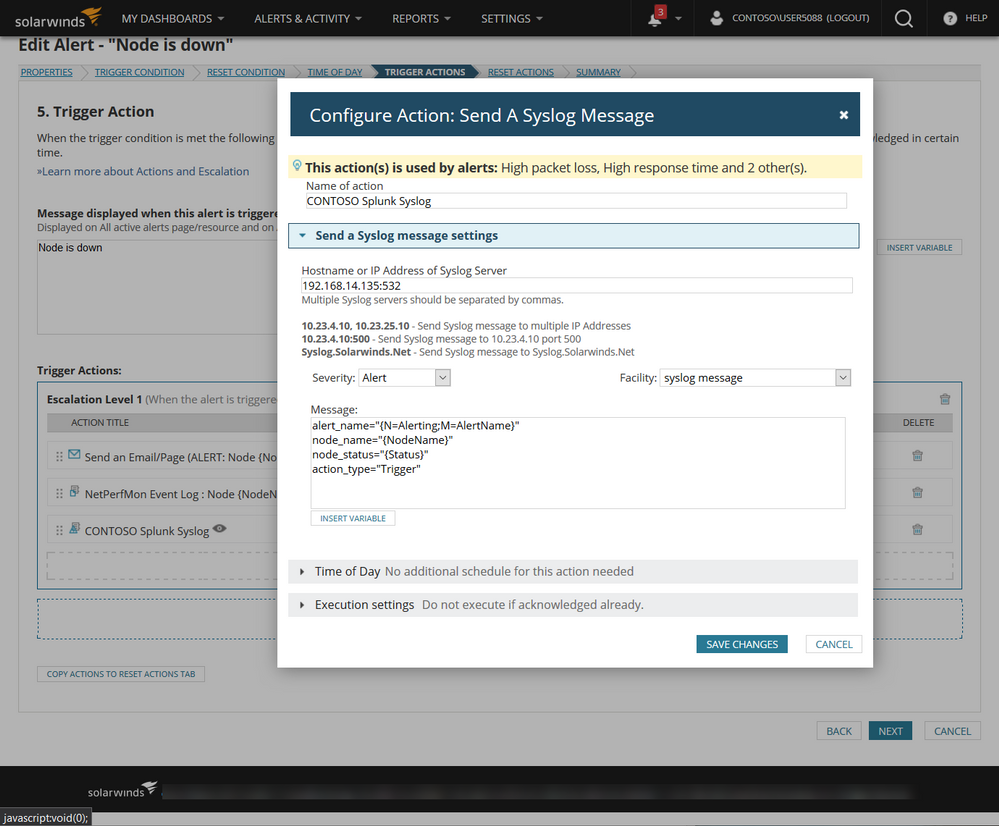
Step 5) Add a Trigger Action to your Alert. Choose Send A Syslog Message. Provide the Splunk Syslog Forwarder IP and Port. Make sure that you the exact message tags so that the Splunk dashboard is able to find the indexed data.

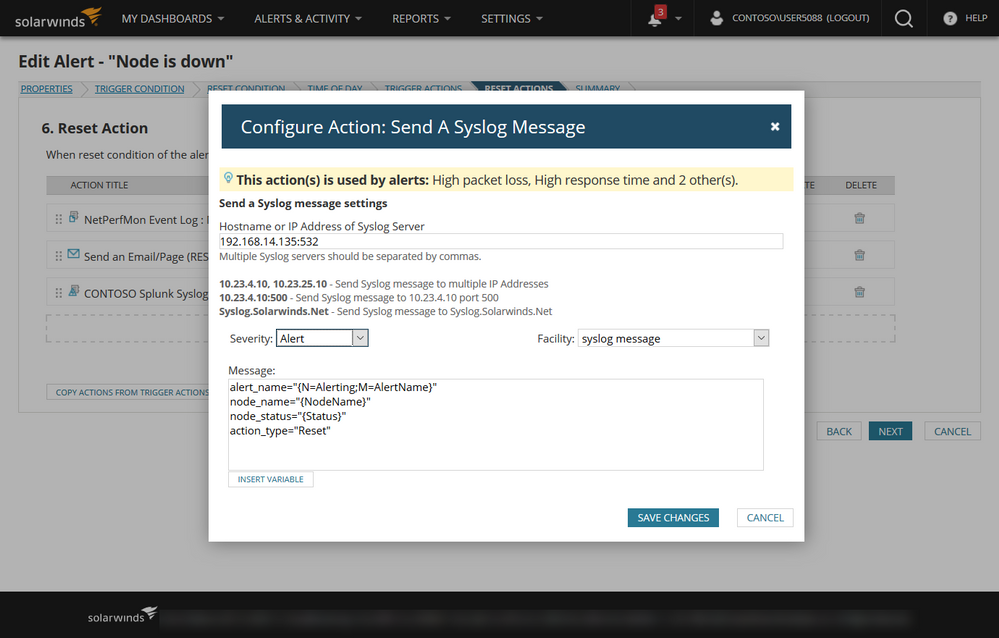
Step 6) Add a Reset Action to your Alert. Choose Send A Syslog Message. Provide the Splunk Syslog Forwarder IP and Port. Make sure that you the exact message tags so that the Splunk dashboard is able to find the indexed data.

Step 7) You can choose to test your alert with Solarwinds or reboot the device you are monitoring to trigger the alert. I configure my alerts to send email for both trigger and reset to make sure that i know that the alert is working as expected.
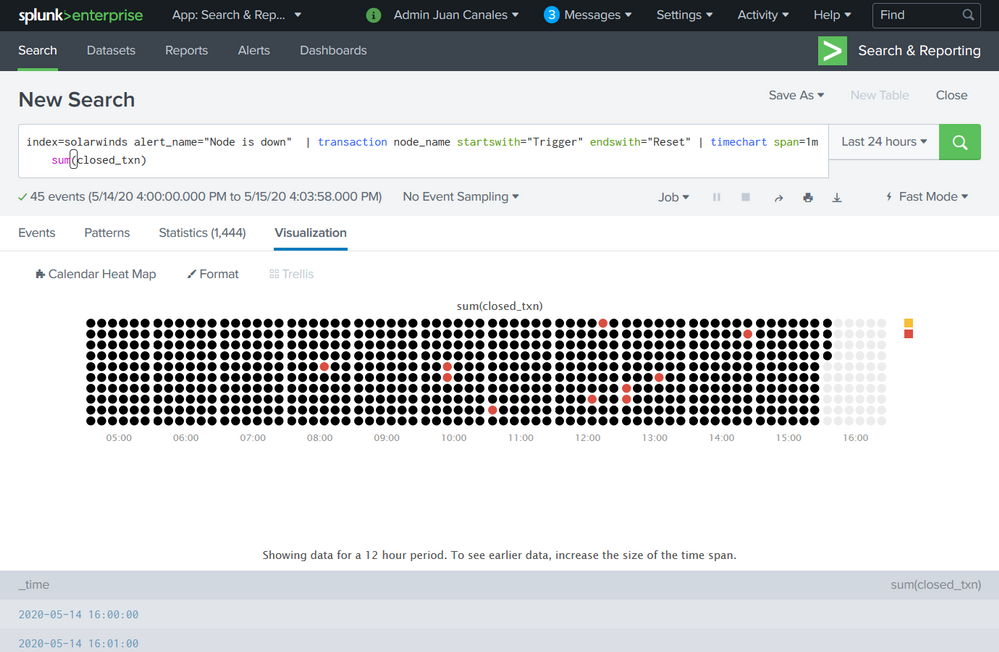
Step 😎 You can run the following SPL search to see if there is any data being collected. If you have successfully returned events you will now are able to run the full dashboard.

Contoso Node Availability Source Code
<form theme="dark">
  <label>Contoso Node Availability</label>
  <fieldset submitButton="true" autoRun="true">
    <input type="time" token="tok.time">
      <label></label>
      <default>
        <earliest>-24h@h</earliest>
        <latest>now</latest>
      </default>
    </input>
  </fieldset>
  <row>
    <panel>
      <title>Availability 12 Hours</title>
      <viz type="calendar_heatmap_app.calendar_heatmap">
        <search>
          <query>index=solarwinds alert_name="Node is down"  | transaction node_name startswith="Trigger" endswith="Reset" | timechart span=1m sum(closed_txn)</query>
          <earliest>-24h@h</earliest>
          <latest>now</latest>
          <sampleRatio>1</sampleRatio>
        </search>
        <option name="calendar_heatmap_app.calendar_heatmap.cellPadding">2</option>
        <option name="calendar_heatmap_app.calendar_heatmap.cellSize">10</option>
        <option name="calendar_heatmap_app.calendar_heatmap.cellStyle">circle</option>
        <option name="calendar_heatmap_app.calendar_heatmap.legendType">uniform</option>
        <option name="calendar_heatmap_app.calendar_heatmap.maxColor">#dc4e41</option>
        <option name="calendar_heatmap_app.calendar_heatmap.minColor">#f8be34</option>
        <option name="calendar_heatmap_app.calendar_heatmap.numOfBins">3</option>
        <option name="calendar_heatmap_app.calendar_heatmap.showLegend">1</option>
        <option name="calendar_heatmap_app.calendar_heatmap.splitMonths">1</option>
        <option name="drilldown">none</option>
        <option name="height">200</option>
        <option name="refresh.display">progressbar</option>
        <option name="trellis.enabled">0</option>
        <option name="trellis.scales.shared">1</option>
        <option name="trellis.size">medium</option>
      </viz>
    </panel>
  </row>
  <row>
    <panel>
      <title>Availability 14 Days</title>
      <viz type="calendar_heatmap_app.calendar_heatmap">
        <search>
          <query>index=solarwinds alert_name="Node is down"  | transaction node_name startswith="Trigger" endswith="Reset" | timechart span=1h sum(closed_txn)</query>
          <earliest>-14d@d</earliest>
          <latest>now</latest>
          <sampleRatio>1</sampleRatio>
        </search>
        <option name="calendar_heatmap_app.calendar_heatmap.cellPadding">2</option>
        <option name="calendar_heatmap_app.calendar_heatmap.cellSize">10</option>
        <option name="calendar_heatmap_app.calendar_heatmap.cellStyle">circle</option>
        <option name="calendar_heatmap_app.calendar_heatmap.legendType">uniform</option>
        <option name="calendar_heatmap_app.calendar_heatmap.maxColor">#dc4e41</option>
        <option name="calendar_heatmap_app.calendar_heatmap.minColor">#f8be34</option>
        <option name="calendar_heatmap_app.calendar_heatmap.numOfBins">3</option>
        <option name="calendar_heatmap_app.calendar_heatmap.showLegend">1</option>
        <option name="calendar_heatmap_app.calendar_heatmap.splitMonths">1</option>
        <option name="drilldown">none</option>
        <option name="height">164</option>
        <option name="refresh.display">progressbar</option>
        <option name="trellis.enabled">0</option>
        <option name="trellis.scales.shared">1</option>
        <option name="trellis.size">medium</option>
      </viz>
    </panel>
  </row>
  <row>
    <panel>
      <title>Availability 12 Months</title>
      <viz type="calendar_heatmap_app.calendar_heatmap">
        <search>
          <query>index=solarwinds alert_name="Node is down"  | transaction node_name startswith="Trigger" endswith="Reset" | timechart span=1d sum(closed_txn)</query>
          <earliest>-12mon</earliest>
          <latest>now</latest>
          <sampleRatio>1</sampleRatio>
        </search>
        <option name="calendar_heatmap_app.calendar_heatmap.cellPadding">2</option>
        <option name="calendar_heatmap_app.calendar_heatmap.cellSize">10</option>
        <option name="calendar_heatmap_app.calendar_heatmap.cellStyle">circle</option>
        <option name="calendar_heatmap_app.calendar_heatmap.legendType">uniform</option>
        <option name="calendar_heatmap_app.calendar_heatmap.maxColor">#dc4e41</option>
        <option name="calendar_heatmap_app.calendar_heatmap.minColor">#f8be34</option>
        <option name="calendar_heatmap_app.calendar_heatmap.numOfBins">3</option>
        <option name="calendar_heatmap_app.calendar_heatmap.showLegend">1</option>
        <option name="calendar_heatmap_app.calendar_heatmap.splitMonths">1</option>
        <option name="drilldown">none</option>
        <option name="height">201</option>
        <option name="refresh.display">progressbar</option>
        <option name="trellis.enabled">0</option>
        <option name="trellis.scales.shared">1</option>
        <option name="trellis.size">medium</option>
      </viz>
    </panel>
  </row>
  <row>
    <panel>
      <title>Availability Top 24 Last 30 Days</title>
      <chart>
        <search>
          <query>index=solarwinds alert_name="Node is down"  | transaction node_name startswith="Trigger" endswith="Reset"  | stats count(node_name) AS Down by node_name | sort -Down limit=25</query>
          <earliest>-30d@d</earliest>
          <latest>now</latest>
        </search>
        <option name="charting.chart">pie</option>
        <option name="charting.drilldown">none</option>
        <option name="refresh.display">progressbar</option>
      </chart>
    </panel>
  </row>
</form>
- Mark as New
- Bookmark Message
- Subscribe to Message
- Mute Message
- Subscribe to RSS Feed
- Permalink
- Report Inappropriate Content
While you can send data outbound from SW via syslog, it's not the best or most efficient method. You'd basically be crafting either
1) a single alert that sends a syslog for each data point you want exported
or
2) multiple alerts that send syslogs for specific types of events/data collections
(remember, alerts are queries, so you'd be banging the database with queries on a near constant basis, obstructing the ability of the database to do the thing you want - which is to collect monitoring data.)
SolarWinds has a full REST-ful API (it's on Github, look for "SolarWinds Orion API" and you'll find it) which would let craft a script that exported the data you wanted, when you wanted, with all appropriate security checks, throttling, etc in place. There's a whole forum dedicated to building this kind of stuff on THWACK.com.
If you are still committed to the syslog method, I'd just want to add a couple of other thoughts:
- syslog-ng is awesome. But if you're group is not comfortable with nix, it might be hard to set up and manage. In that case I'd recommend Kiwi Syslog. No, not because I'm a shill for SolarWinds, but because it's the only *other tool that does "transparent forwarding" of syslogs - meaning that the original source IP is retained when you forward. That's critical in this situation since you don't want splunk to think that it was the solarwinds box sending all those syslogs.
- if you have syslog coming to splunk from a number of sources, it's going to get chattier than any single machine can handle. I don't care what vendor we're talking about. To mitigate that, you need to build a "trap and syslog filtration system". that looks like this:
- a load balancer set to do UDP round robin forwarding to a pool of devices
- the devices are all running either syslog-ng or kiwi syslog (for the reasons cited above) and the rulesets synchronized across all pool members
- the rules will send relevant events to solarwinds, splunk, etc
- the rules can ALSO send events to the audit team, network team, etc if they have their own systems they need to maintain. That reduces the number of un-necessary (but expensive) transactions you are throwing at your splunk server.
FINALLY:
I'm going to take off my SolarWinds hat and put on my "I've been doing monitoring for 20 years" hat - remember that monitoring is fundamentally a heterogeneous pass time. There's no one-size-fits-all solution (hell, there's not even a one-size-fits-most solution!). While you want to avoid dealing with 27 tools that do the same thing, you are going to have a mix of primary and secondary sources of truth; of cheap (sorry, "economical") systems that do the dog's work of monitoring and pricey solutions that provide laser-pinpoint insight for a specific condition. Just make sure you're designing for the correct mix.
Hope this helps.
- Leon Adato
- Mark as New
- Bookmark Message
- Subscribe to Message
- Mute Message
- Subscribe to RSS Feed
- Permalink
- Report Inappropriate Content
Best and easiest path -
1) Build a syslog server (I suggest syslog-ng). Instructions abound on the internet for this. For this purpose, it shouldn't have to be huge - a smallish linux VM would be fine.
2) Make solarwinds do syslog, sending it to that server. (If SW can't syslog, this is a problem we can't fix).
3) Then install the Splunk universal forwarder on that machine, have it read/parse the files and send them in.
4) (and more steps mostly not specific to this task, but important, like don't forget to logrotate them and so on.)
Happy Splunking!
-Rich
- Mark as New
- Bookmark Message
- Subscribe to Message
- Mute Message
- Subscribe to RSS Feed
- Permalink
- Report Inappropriate Content
Hello Richfez,
Good day, appreciate if you can explain in details on point no 3 & no 4
Thank you.
- Mark as New
- Bookmark Message
- Subscribe to Message
- Mute Message
- Subscribe to RSS Feed
- Permalink
- Report Inappropriate Content
It's mostly in the docs:
https://docs.splunk.com/Documentation/Forwarder/8.2.5/Forwarder/Installtheuniversalforwardersoftware
and maybe
https://docs.splunk.com/Documentation/Forwarder/8.2.5/Forwarder/Configuretheuniversalforwarder
As to logrotate - that's all outside of Splunk. Basic Linux maintenance on log files. Any internet search engine is your friend here and all will lead to results that are useful. Best search may be though to get some "Splunk specific" search results, using a search like "splunk syslog" and read through a few of those best practices that will come up.
