- Apps & Add-ons
- :
- Splunk Development
- :
- Splunk Dev
- :
- Restricted Searches and job inspector- Can I use ...
- Subscribe to RSS Feed
- Mark Topic as New
- Mark Topic as Read
- Float this Topic for Current User
- Bookmark Topic
- Subscribe to Topic
- Mute Topic
- Printer Friendly Page
- Mark as New
- Bookmark Message
- Subscribe to Message
- Mute Message
- Subscribe to RSS Feed
- Permalink
- Report Inappropriate Content
Hello, Let's say I have many dashboards, inside each dashboard I have 10 base searches, and many visualizations on it.
Some users that use the dashboards have "Restricted Rules" on the searches, sometimes by time or by size.
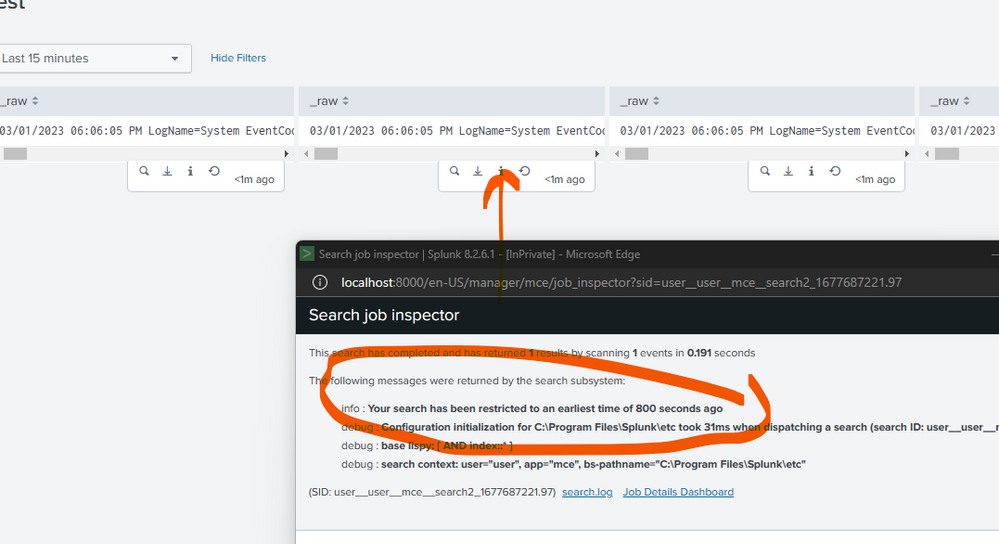
My problem is that the end user's that enter the dashboards and choose the time, he can't know that his data that he sees sometimes limited to the rules that apply on him. The normal way to know if the data that you see is limited in each panel is to use the hover small Buttons and click on inspect Button.
I try to make a script that make a popup that aware the user if he got restricted but there must be a better way to achieve a solution for this.
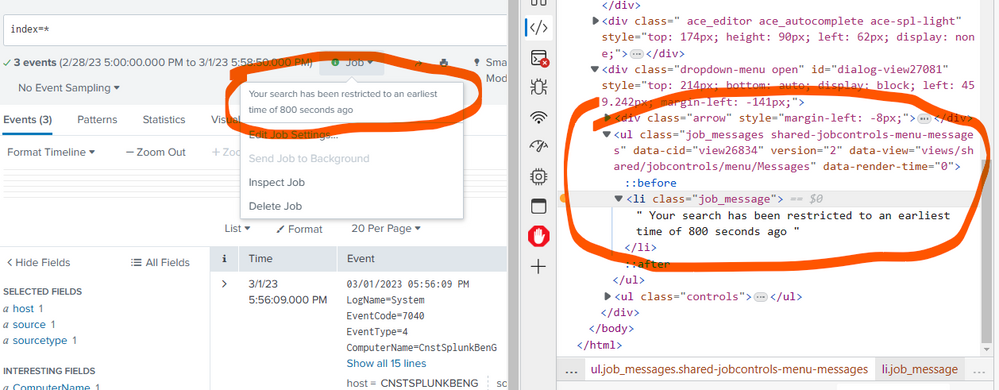
I’ve seen that Splunk have built in option in the drop down menu of a search that show that message if he found some.. anyone have an idea how to implement this in script that will affect all dashboards?
I will attach the script that I did and some pictures to show what I mean..
require([
    'splunkjs/mvc',
    "splunkjs/mvc/searchmanager",
    'jquery',
    "/static/app/mce/javascript/popup_Modal.js",
    "splunkjs/mvc/simplexml/ready!"
],
    function (mvc, SearchManager, $, Modal) {


        var registry = mvc.Components;
        console.log(registry)

        var envTokenModel = mvc.Components.get('env');

        // Grab a specific env token
        var username = envTokenModel.get('user');
        var app = envTokenModel.get('app');
        var page = envTokenModel.get('page');
        var searchMceJobs = "| search index=_introspection | rename search_id as JobId | join left JobId [| rest /services/search/jobs | rename dispatchState as Status eai:acl.app as App title as Search author as User runDuration as Runtime published as Published id as ID provenance as Provenance | rex field=Provenance \"UI:Dashboard:(?<Dashboard>.+)\" | search Dashboard=*| rex field=ID \"(?<JobId>[^//]*)$\"| eval Status=mvjoin(mvsort(mvdedup(split(mvjoin(Status,\",\"),\",\"))),\",\")| eval Runtime=round(Runtime,1) |  where User = " + '"' + username + '"' + " And App = " + '"' + app + '"' + " And Dashboard = " + '"' + page + '"' + " ] | stats values(messages.info) as MSG by JobId User Dashboard App updated | table MSG | sort updated"

        // Log all env tokens
        console.log(envTokenModel.toJSON());

        // React to env token changes:
        envTokenModel.on('change', function () {
            //console.log(arguments);
        });


        setTimeout(function run() {


            // Create the search manager
            var mysearch = new SearchManager({
                id: 'MceSearch',
                cache: false,
                preview: true,
                search: searchMceJobs,
                earliest_time: "-10s",
                latest_time: "now",
            });
            mvc.Components.revokeInstance("MceSearch");


            mysearch.on('search:done', function (properties) {
                console.log(properties.content)
                console.log(properties.content.resultCount)
                if (properties.content.resultCount > 0) {
                    // Print the search job properties
                    console.log("DONE!\nSearch job properties:", properties.content.resultCount);
                     oldResult = properties.content.resultCount


                    var myModal = new Modal("popupModal", {
                        title: properties.content.resultCount,
                        backdrop: 'static',
                        keyboard: false,
                        destroyOnHide: true,
                        type: 'normal'
                    });
                    $(myModal.$el).on("hide", function () {
                        //console.log('test123')
                        // Not taking any action on hide, but you can if you want to!
                    })
                    myModal.body
                        .append($(`
                    <p>${properties.content.resultCount}</p>`));
                    myModal.footer.append($('<button>').attr({
                        type: 'button',
                        'data-dismiss': 'modal'
                    }).addClass('btn btn-primary').text('ok').on('load', function () {
                        // Not taking any action on Close... but I could!
                    }))
                    myModal.show(); // Launch it!


                }
            });
            //setInterval(run, 5000);
        }, 5000);
        console.log('timeout active')

        //


    });
- Mark as New
- Bookmark Message
- Subscribe to Message
- Mute Message
- Subscribe to RSS Feed
- Permalink
- Report Inappropriate Content
I have another way to check the search log using javascript, it may be useful to you. I'm sharing my sample code here.
<dashboard version="1.1" script="js/a.js">
  <label>Restricted Searches and job inspector</label>
  <row>
    <panel>
      <table>
        <search id="searchTkn">
          <query>index="_internal" | stats count by sourcetype</query>
          <earliest>-24h@h</earliest>
          <latest>now</latest>
        </search>
        <option name="drilldown">none</option>
      </table>
    </panel>
  </row>
</dashboard>
require([
  'underscore',
  'jquery',
  'splunkjs/mvc',
  'splunkjs/mvc/tableview',
  'splunkjs/mvc/simplexml/ready!'
], function(_, $, mvc) {
    console.log("searchTkn");
    var searchTkn = mvc.Components.getInstance("searchTkn");
    var service = mvc.createService({ owner: "nobody" });

    searchTkn.on("search:done", function(properties) {
        console.log(properties);
        console.log(properties.links);
        console.log(properties.links["search.log"]);

        service.request(properties.links["search.log"], "GET", null, null, null, { "Content-Type": "application/json" }, null).done(function(response) {
            console.log(response);
            // Apply your grep OR filter logic as per your requirement
        });
    })
});
Use the above code to get the search log and integrate Modal View if you get your required error/ information in log.
I hope this will help you.
Thanks
KV
If any of my replies help you to solve the problem Or gain knowledge, an upvote would be appreciated.


