- Find Answers
- :
- Splunk Platform
- :
- Splunk Cloud Platform
- :
- Capacity health check dashboard and query
- Subscribe to RSS Feed
- Mark Topic as New
- Mark Topic as Read
- Float this Topic for Current User
- Bookmark Topic
- Subscribe to Topic
- Mute Topic
- Printer Friendly Page
- Mark as New
- Bookmark Message
- Subscribe to Message
- Mute Message
- Subscribe to RSS Feed
- Permalink
- Report Inappropriate Content
Capacity health check dashboard and query
Hi All,
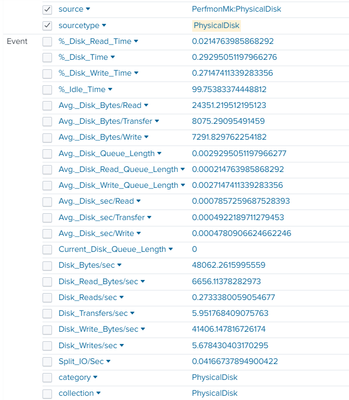
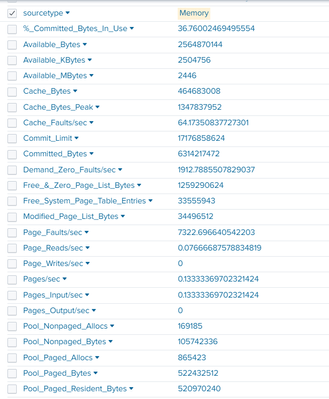
I wanted to capture both Windows and Unix servers CPU, Memory and Disk usage. below are sample event.
- Mark as New
- Bookmark Message
- Subscribe to Message
- Mute Message
- Subscribe to RSS Feed
- Permalink
- Report Inappropriate Content
Hey @ShamGowda ,
What is the concern here? Have you got the data already in the respective index? Also, have you explored Splunkbase already? There are quite lots of apps that helps visualizing the memory and CPU usage.
Thanks,
Tejas.
- Mark as New
- Bookmark Message
- Subscribe to Message
- Mute Message
- Subscribe to RSS Feed
- Permalink
- Report Inappropriate Content
I am receiving the logs and required query to monitor top 10 highest use CPU, Memory, processor and Disk
- Mark as New
- Bookmark Message
- Subscribe to Message
- Mute Message
- Subscribe to RSS Feed
- Permalink
- Report Inappropriate Content
These are some basic examples once you have ingested the data, the same principles apply to Windows metrics
Analyse the data, work out the fields that contain the data and work on SPL, until it gives you the results
This example shows how you can monitor linux metrics - change the threshold (| where cpu_load_percent >=1)
index=linux sourcetype=cpu
| fields _time, host, cpu_load_percent,
| eval date_time =strftime(_time, "%d/%m/%Y %H:%M:%S")
| where cpu_load_percent >=1
| table date_time, host, cpu_load_percent
| dedup host
This example shows how you can memory percent % linux metrics - change the threshold (| where PercentMemory >=0)
index=linux sourcetype=ps
| fields _time, host, PercentMemory
| eval date_time =strftime(_time, "%d/%m/%Y %H:%M:%S")
| where PercentMemory >=0
| table date_time, host, PercentMemory
| dedup host
Do similar for Disk/processor etc


