- Find Answers
- :
- Splunk Administration
- :
- Admin Other
- :
- Security
- :
- Detecting Beaconing Using Fourier Transform (FFT)
- Subscribe to RSS Feed
- Mark Topic as New
- Mark Topic as Read
- Float this Topic for Current User
- Bookmark Topic
- Subscribe to Topic
- Mute Topic
- Printer Friendly Page
- Mark as New
- Bookmark Message
- Subscribe to Message
- Mute Message
- Subscribe to RSS Feed
- Permalink
- Report Inappropriate Content
Does anyone know of an add-on or other script that would allow one to analyze network traffic to detect beaconing using a Fourier transform (FFT)?
- Mark as New
- Bookmark Message
- Subscribe to Message
- Mute Message
- Subscribe to RSS Feed
- Permalink
- Report Inappropriate Content
You can extend Splunk Machine Learning Toolkit to include the FFT algorithm. The following is an example adapted from https://www.ritchievink.com/blog/2017/04/23/understanding-the-fourier-transform-by-example/.
First, let's generate the sample data:
| makeresults count=500
| streamstats count as t
| eval t=exact(t/1000)-0.001, s=sin(40*2*pi()*t)+0.5*sin(90*2*pi()*t)
| table t s
We should have signals with frequencies of 40 and 90 cycles.
Next, let's add our algorithm stanza to $SPLUNK_HOME/etc/apps/Splunk_ML_Toolkit/local/algos.conf:
[FFT]Restart Splunk to enable the algorithm.
Next, let's write the algorithm interface in $SPLUNK_HOME/etc/apps/Splunk_ML_Toolkit/bin/algos/FFT.py. This is just an example with no input validation:
#!/usr/bin/env python

import numpy as np
import pandas as pd

from base import BaseAlgo

class FFT(BaseAlgo):
    def __init__(self, options):
        # Option checking & initializations here
        pass

    def fit(self, df, options):
        # Fit an estimator to df, a pandas DataFrame of the search results

        s = df[self.target_variable]
        t = df[self.feature_variables]

        fft = np.fft.fft(s)
        T = t[t.columns[0]][1] - t[t.columns[0]][0]
        N = fft.size
        freq = np.linspace(0, 1 / T, N)[:N // 2]
        amp = np.abs(fft)[:N //2 ] * 1 / N

        df = pd.DataFrame({'Frequency': freq, 'Amplitude': amp}, columns=['Frequency', 'Amplitude'])

        return df
Finally, let's try the algorithm with the fit command:
| makeresults count=500
| streamstats count as t
| eval t=exact(t/1000)-0.001, s=sin(40*2*pi()*t)+0.5*sin(90*2*pi()*t)
| table t s
| fit FFT s from t
Signals were detected at 40 and 90 cycles with the amplitudes (halved) shown.
If you have a sample data set, we can test it directly.
- Mark as New
- Bookmark Message
- Subscribe to Message
- Mute Message
- Subscribe to RSS Feed
- Permalink
- Report Inappropriate Content
Drop the mic and let me buy you a drink at the next .CONF!
- Mark as New
- Bookmark Message
- Subscribe to Message
- Mute Message
- Subscribe to RSS Feed
- Permalink
- Report Inappropriate Content
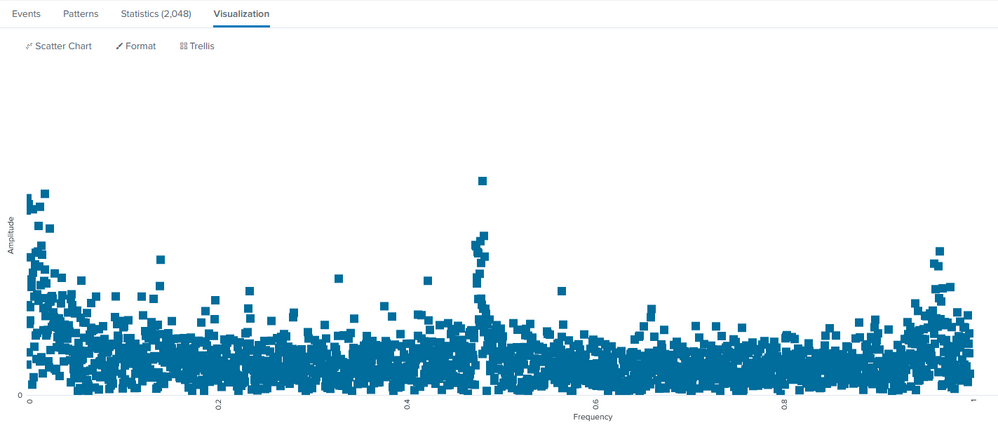
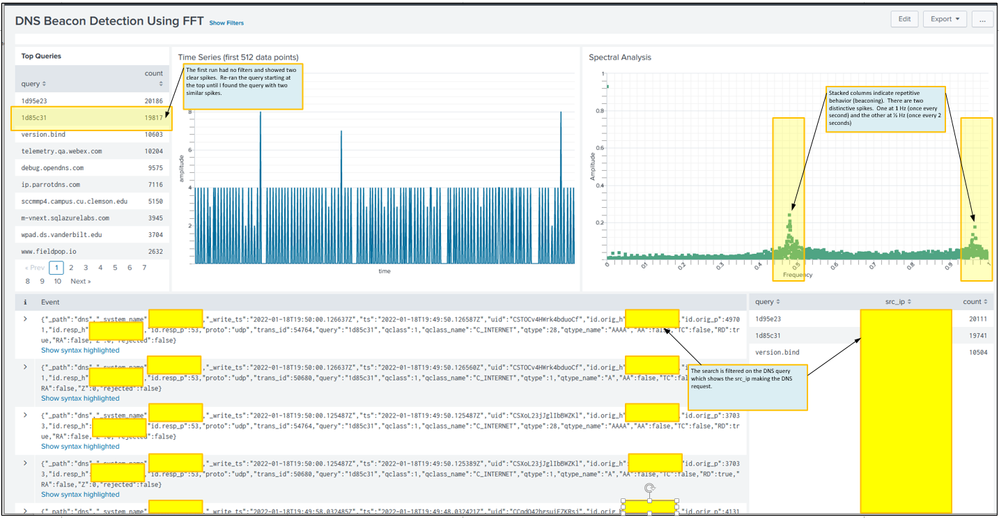
So here's a scatter chart plotting the resultant magnitude. I find a scatter chart a little easier to see the dominant frequencies (those that show stacked columns). Clearly there is a strong beacon at 1 Hz and even stronger one at 1/2 Hz (every 2 sec). There are probably others to inspect.
The data was generated looking at DNS traffic from Corelight data. The data could have come from Splunk Stream just as easily, but we already have a Corelight infrastructure. The query excludes internal DNS traffic and includes only A, AAAA, TXT DNS records. Of course there's a lot of other factors such as DNS caching and rotating ads to consider.
Now on to some addition hunting to find and exclude benign sources and hopefully find nothing! As an aside, if anyone wants to see an fun use of the Fourier series, lookup "Fourier" and "Homer Simpson" on YouTube and see how Fourier series can draw Homer.
- Mark as New
- Bookmark Message
- Subscribe to Message
- Mute Message
- Subscribe to RSS Feed
- Permalink
- Report Inappropriate Content
You've adapted this better than I have! I was looking for ways to define and group FFT output by specific features, e.g. src-dest tuples.
What general form did your base search take?
- Mark as New
- Bookmark Message
- Subscribe to Message
- Mute Message
- Subscribe to RSS Feed
- Permalink
- Report Inappropriate Content
The query is something like this:
- The query uses CoreLight data and excludes local and well known sources.
- | timechart count as s span=5ds
- | fillnull value = 0
- | eval time_interval = 0.5
- | eval sequence_number = 1
- | streamstats current=f sum(sequence_number) as seq
- | streamstats sum(time_interval) as time
- | eval time = time - time_interval
- | head=4096
- | table time, s
- | fit FFT s from time
Still working with it .... Do you have any suggestions, improvements?
- Mark as New
- Bookmark Message
- Subscribe to Message
- Mute Message
- Subscribe to RSS Feed
- Permalink
- Report Inappropriate Content
So here's a sample dashboard.


