- Find Answers
- :
- Using Splunk
- :
- Other Using Splunk
- :
- Reporting
- :
- multireport vs. appendpipe
- Subscribe to RSS Feed
- Mark Topic as New
- Mark Topic as Read
- Float this Topic for Current User
- Bookmark Topic
- Subscribe to Topic
- Mute Topic
- Printer Friendly Page
- Mark as New
- Bookmark Message
- Subscribe to Message
- Mute Message
- Subscribe to RSS Feed
- Permalink
- Report Inappropriate Content
Code Architecture:
- common code generating initial results; generate unique key for each grouping
- multireport or appendpipe
- stanza 1 with its own set of stats, evals, etc.; uses the key from the common code
- stanza 2 with its own set of stats, evals, etc.; uses the key from the common code
- Aggregates the resulting data from the common, stanza1, stanza2 results using the key
Issue Statement
- common code + stanza 1 takes about 1 min to execute
- common code + stanza 2 takes about 1 min to execute
- common code + stanza 1 + stanza2 using either a multireport or appendpipe takes about 17 min
[Q] Does this huge execution time difference make sense?
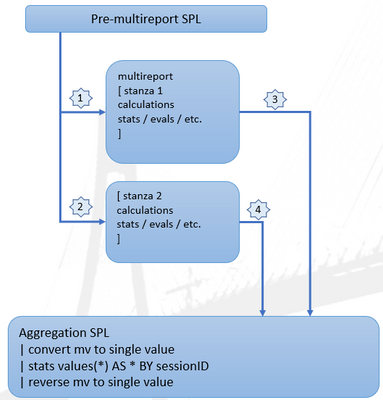
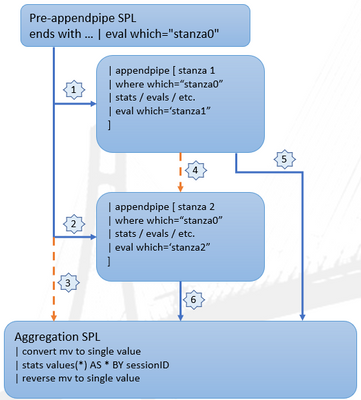
I have attached a few images to show how I think multireport and appendpipe work.
[Q] Is my understanding accurate?
 | The pre-appendpipe SPL reads the data from the index, filters the data, creates some initial fields using streamstats and eventstats and creates a key that is unique per the overall groupings correlated within this code. Lines 3 and 4 are independent results from stanza1 and stanza2 respectively stanza1 and stanza2 execute mutually exclusive from one another The sort and stats clauses within stanza1 and stanza2 are quite different but the one does NOT impact the other. The final aggregation software ties all the data together based on a common key. |
 | The pre-appendpipe SPL reads the data from the index, filters the data, creates some initial fields using streamstats and eventstats and creates a key that is unique per the overall groupings correlated within this code. Lines 3 and 4 CAN be removed if I filter the input data with a where clause and the flag I called "which" associated with each set of data. Lines 5 and 6 are independent results from stanza1 and stanza2 respectively stanza1 and stanza2 execute mutually exclusive from one another. The stats clauses within stanza1 and stanza2 are quite different but the one does NOT impact the other. The final aggregation software ties all the data together based on a common key. |
- Mark as New
- Bookmark Message
- Subscribe to Message
- Mute Message
- Subscribe to RSS Feed
- Permalink
- Report Inappropriate Content
Update to the appendpipe version of code
I eliminated stanza2 and the final aggregation SPL reducing the overall code to just the pre-appendpipe SPL and stanza 1 but leaving the appendpipe nomenclature in the code.
Total execution time = 486 sec
Then for this exact same search, I eliminated the appendpipe syntax. Everything is the same except for the | appendpipe and [ ] syntax.
Total execution time = 77 sec
The overhead to using appendpipe is HUGE.
I suspect the same is true for using multireport.
