Are you a member of the Splunk Community?
- News & Events
- :
- Blog & Announcements
- :
- Product News & Announcements
- :
- Observability Highlights | September 2022 Newslett...
Observability Highlights | September 2022 Newsletter
- Subscribe to RSS Feed
- Mark as New
- Mark as Read
- Bookmark Topic
- Subscribe
- Printer Friendly Page
- Report Inappropriate Content
September 2022
Splunk Observability Suite
Access to "Classic" SignalFx Interface Will be Removed on Sept 30, 2022
Over the past two years, we have been working hard to create the best experience for Splunk Observability Cloud customers. We feel that we have reached an inflection point where the Splunk Observability user experience far surpasses that of the classic SignalFx version (which is still accessible).
That is why starting Sep 30, 2022, the “Switch to Classic” functionality will be removed. Access to the original user interface will no longer be available.
What that means for you, the customer:
- There are no major changes to the experience for users other than not being able to access the “Classic” user interface
- There is no action required of admins or users of the product
- Any URLs containing “../classic/#/home…” will be redirected to the new URL path; which means nothing will break if you have classic URLs bookmarked. You will simply be led to the new user interface
Thank you for being a customer of Splunk Observability Cloud and providing the feedback to continue making the product industry-leading.
Have questions or need more clarification? Please reach out via the Support Portal.
Splunk Synthetic Monitoring
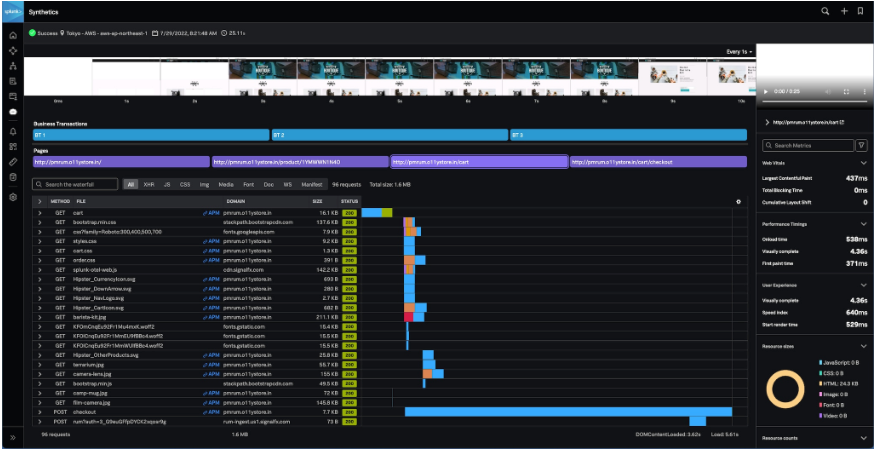
Splunk Synthetic Monitoring is now available in Splunk Observability Cloud allowing your IT and engineering teams to proactively detect issues impacting web performance, API performance and end-user experience, and troubleshoot and remediate issues in the web browser, the server, or a third-party dependency.
With the addition of Synthetic Monitoring to the Observability Cloud, which already includes Infrastructure Monitoring (IM), Application Performance Monitoring (APM), Log Observer, and Real User Monitoring (RUM)l, Splunk now offers you a comprehensive solution for end-to-end observability—all within a single UI.
You can read more about Synthetic Monitoring here.
Splunk APM
Visual Feedback on Splunk APM Trace Search
With visual feedback on trace search, get immediate feedback on matches and errors, as well as when there are no matches in the trace search results. You can sort your trace search results on timestamp / duration and narrow down the search range on the interactive chart to see relevant traces. Learn more here.
AlwaysOn Code Profiling
We are excited to announce new capabilities for AlwaysOn Profiling, a function of Splunk APM! With this launch, we are building on our existing AlwaysOn capability to profile CPU consumption for Java applications by adding:
- Memory Profiling for Java
- CPU Profiling for .NET and Node.js
These innovations help you identify service performance and resource consumption problems, in context with your trace data, all with minimal overhead. And the best part is - if you’re already using Splunk APM with host-based pricing, you can easily set it up today!
New Observability Blogs
- Splunk APM Expands Code Profiling Capabilities with Several New GAs
- Using Splunk Observability Cloud to Monitor Splunk RUM
- Announcing the General Availability of Synthetic Monitoring Within Splunk Observability
- The Next Frontier for Observability: Data Ownership with OpenTelemetry
Want a chance to win $500 to the Splunk shop? Take our IT Incident Management Survey!
Splunk is partnering up with Constellation Research to define the top trends & best practices in IT incident management. If you are an IT or DevOps professional that responds to incidents or manages on-call, we’d love your opinion.
So what’s in it for you?
In addition to sharing your thoughts and having them included in the final report, once you complete the survey, you’ll be entered for a chance to win a $500 credit to the Splunk shop!

Splunk Lantern published 11 new articles in August, including an updated FAQ for the Splunk Platform 9.0.1 release. In addition to this great content, we've made the following updates.
- We rebranded from a "Resource Center" to a "Customer Success Center". We want to make clear that we are here to help you succeed with Splunk. If you need help getting started with a new product, learning how to ingest a new data source, or figuring out how to implement an observability use case, we're here for you. All our articles are written by Splunk experts who work in the field every day with customers just like you, so you know you're getting the best guidance possible to get you Splunking your data faster and better
- We’ve launched a new feedback widget on our site! The orange tab on the left-hand side allows you to tell us how articles are working for you or where improvement is needed. The survey is anonymous, so you won’t be able to receive a direct response to any comments you leave. However, you can always talk to us directly on the Splunk User Groups Slack or Reddit. Please take the time to leave feedback on our articles so we can make sure our content is effective in helping you succeed with Splunk!
- Finally, if you have been accessing Splunk Lantern articles using the knowledge bots of the Splunk Product Guidance app in Splunk Cloud Platform, please note that those bots have been removed based on feedback. We apologize if you found those bots helpful, but don't worry - none of the great content has gone away. You can still search for help with SPL and data source onboarding at any time on lantern.splunk.com

New Splunkbase Preview
Have you tried the new Splunkbase preview? Soon it will exit preview and become the default view for Splunkbase! But why wait? Visit today and experience the faster page loads, better search results, cleaner app directory and app cards and more!
An App for Clearer Queries and Better Results?
Security and IT analysts need to be able to find threats and issues without having to write complex search queries. The Splunk Common Information Model (CIM) app delivers a common lexicon of field names and event types across different vendor data sources making them consistent so that analysts can write clearer queries and get better results with more true positives and fewer false positives.
Learn more in this “Introduction to Splunk Common Information Model” video and in the .conf22 “Finding Threats Better With Splunk® Common Information Model (CIM) in Your Searches and Custom Add-o...” session.
New and Recent Updates
Are you using Puppet for IT automation? The recently updated Puppet Report Viewer app for Splunk integrates Puppet Enterprise or Puppet open source with Splunk to send Puppet node inventory, node facts, report summaries and report details into Splunk from one or more Puppet primary servers and automate taking action by triggering Bolt tasks from Actionable Alerts. See the app
The Splunk Add-on for Google Workspace allows a Splunk administrator to collect Google Workspace event data using Google Workspace APIs. You can then analyze the data in the Splunk platform.
The Splunk App for Zoom provides the interface for searches, reports, and dashboards for your Zoom video conferencing environment. It works in concert with Splunk Connect for Zoom, which connects to your Zoom data, to enable you to monitor, manage, and troubleshoot your Zoom service from a single application.
Have you ever wanted to perform advanced text analytics inside Splunk? Splunk has some ways to handle text but also lacks some more advanced features that NLP libraries can offer. The NLP Text Analytics app provides a simple interface for analyzing text in Splunk using python natural language processing libraries. This can also benefit use-cases that involve using Splunk’s ML Toolkit.

Ongoing Blog Series on OpenTelemetry: Everything you Wanted to Know About Sending Logs to Splunk (With the new OpenTelemetry Collector)
Curious about OpenTelemetry but more interested in logs than APM tracing or metrics? Look no further! This blog post will walk you through your first OpenTelemetry Logging pipeline. The OpenTelemetry project is the second largest project of the Cloud Native Computing Foundation (CNCF).
Read more to learn about sending logs to Splunk with the new OpenTelemetry Collector!
You must be a registered user to add a comment. If you've already registered, sign in. Otherwise, register and sign in.


