Join the Conversation
- Find Answers
- :
- Splunk Administration
- :
- Monitoring Splunk
- :
- Why do HEC metrics result in "JsonLineBreaker" err...
- Subscribe to RSS Feed
- Mark Topic as New
- Mark Topic as Read
- Float this Topic for Current User
- Bookmark Topic
- Subscribe to Topic
- Mute Topic
- Printer Friendly Page
- Mark as New
- Bookmark Message
- Subscribe to Message
- Mute Message
- Subscribe to RSS Feed
- Permalink
- Report Inappropriate Content
Why do HEC metrics result in "JsonLineBreaker" error?
I've seen similar posts but most are without an answer or the answer doesn't apply to me. I'm sending a valid blob of JSON to HEC, and am seeing this error in the log:
ERROR JsonLineBreaker [2809 parsing] - JSON StreamId:0 had parsing error:Unexpected character while looking for value: 'm' - data_source="http:***", data_host="compy-manjaro", data_sourcetype="
_json"
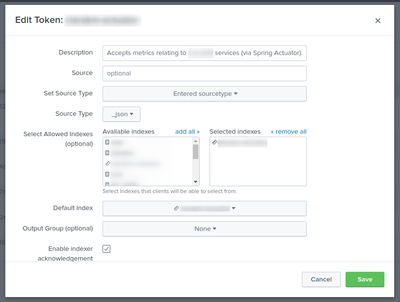
Here is my HEC token's config:
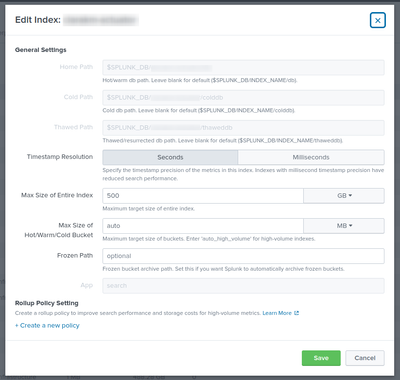
Here is the config of the related index (type is "metrics"):
Here's an example payload:
{
    "event": "metric",
    "time": 1678911825,
    "host": "compy-manjaro",
    "fields":
    {
        "app.name": "my-app",
        "app.version": "v0.0.1 (unknown@unknown)",
        "health:db": 0,
        "health:diskSpace": 0,
        "health:mail": 0,
        "health:ping": 0,
        "application.ready.time:value": 15603.0,
        "application.started.time:value": 15593.0,
        "disk.free:value": 2.210336768E10,
        "disk.total:value": 2.4284653568E11,
        "executor.active:value": 0.0,
        "executor.completed:count": 0.0,
        "executor.pool.core:value": 0.0,
        "executor.pool.max:value": 2.147483647E9,
        "executor.pool.size:value": 0.0,
        "executor.queue.remaining:value": 2.147483647E9,
        "executor.queued:value": 0.0,
        "hikaricp.connections.acquire:count": 12.0,
        "hikaricp.connections.acquire:max": 0.0,
        "hikaricp.connections.acquire:total": 8.146637,
        "hikaricp.connections.active:value": 0.0,
        "hikaricp.connections.creation:count": 0.0,
        "hikaricp.connections.creation:max": 0.0,
        "hikaricp.connections.creation:total": 0.0,
        "hikaricp.connections.idle:value": 11.0,
        "hikaricp.connections.max:value": 40.0,
        "hikaricp.connections.min:value": 10.0,
        "hikaricp.connections.pending:value": 0.0,
        "hikaricp.connections.timeout:count": 0.0,
        "hikaricp.connections.usage:count": 12.0,
        "hikaricp.connections.usage:max": 0.0,
        "hikaricp.connections.usage:total": 59.0,
        "hikaricp.connections:value": 11.0,
        "jdbc.connections.active:value": 0.0,
        "jdbc.connections.idle:value": 11.0,
        "jdbc.connections.max:value": 40.0,
        "jdbc.connections.min:value": 10.0,
        "jvm.buffer.count:value": 17.0,
        "jvm.buffer.memory.used:value": 0.0,
        "jvm.buffer.total.capacity:value": 0.0,
        "jvm.classes.loaded:value": 22964.0,
        "jvm.classes.unloaded:count": 6.0,
        "jvm.gc.live.data.size:value": 0.0,
        "jvm.gc.max.data.size:value": 8.405385216E9,
        "jvm.gc.memory.allocated:count": 1.023410176E9,
        "jvm.gc.memory.promoted:count": 1.22555392E8,
        "jvm.gc.overhead:value": 0.005311596570632951,
        "jvm.gc.pause:count": 9.0,
        "jvm.gc.pause:max": 0.0,
        "jvm.gc.pause:total": 175.0,
        "jvm.memory.committed:value": 1.6449536E7,
        "jvm.memory.max:value": -1.0,
        "jvm.memory.usage.after.gc:value": 0.01895299976219436,
        "jvm.memory.used:value": 1.59307264E8,
        "jvm.threads.daemon:value": 45.0,
        "jvm.threads.live:value": 68.0,
        "jvm.threads.peak:value": 69.0,
        "jvm.threads.states:value": 0.0,
        "logback.events:count": 0.0,
        "process.cpu.usage:value": 0.007488087134104833,
        "process.files.max:value": 524288.0,
        "process.files.open:value": 373.0,
        "process.start.time:value": 1.678911778094E12,
        "process.uptime:value": 47711.0,
        "system.cpu.count:value": 8.0,
        "system.cpu.usage:value": 0.1834410064603876,
        "system.load.average.1m:value": 4.71533203125,
        "tomcat.sessions.active.current:value": 0.0,
        "tomcat.sessions.active.max:value": 0.0,
        "tomcat.sessions.alive.max:value": 0.0,
        "tomcat.sessions.created:count": 0.0,
        "tomcat.sessions.expired:count": 0.0,
        "tomcat.sessions.rejected:count": 0.0
    }
}
- Mark as New
- Bookmark Message
- Subscribe to Message
- Mute Message
- Subscribe to RSS Feed
- Permalink
- Report Inappropriate Content
Hi @JoshMc
Maybe it's something in the _json sourcetype, which would normally be used for a normal JSON events is messing with the metrics.
Try not selecting the preconfigured _json sourcetype in the token configuration. As a metric index the JSON format is implied anyway, so just create a unique sourcetype name or even leave it unselected.
The docs imply no sourcetype should be selected too...
https://docs.splunk.com/Documentation/Splunk/latest/Metrics/GetMetricsInOther#Create_a_data_input_an...
Would be interested to know if this helps.


