- Mark as New
- Bookmark Message
- Subscribe to Message
- Mute Message
- Subscribe to RSS Feed
- Permalink
- Report Inappropriate Content
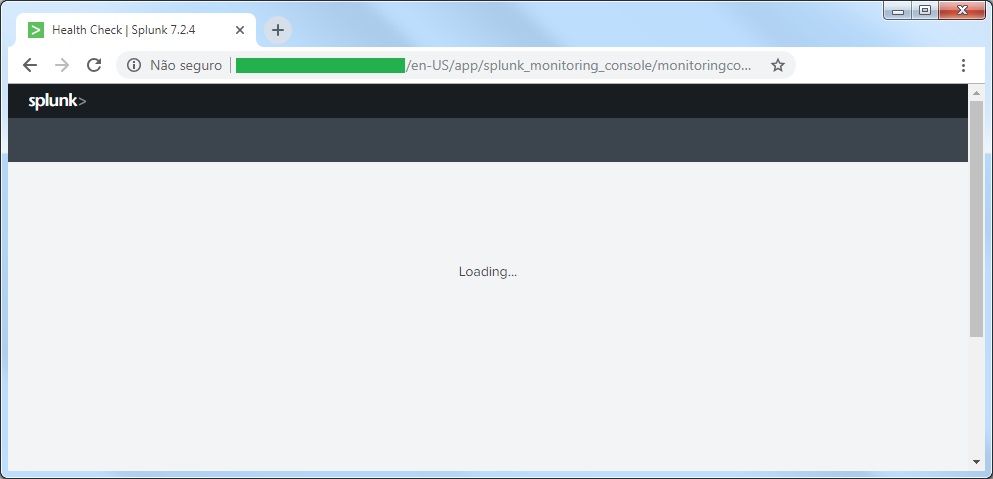
Monitoring Console Health Check does not run, only shows loading page
I'm trying to run Monitoring Console Health Check but it doesn't start. Splunk shows me only "Loading..." page. The checklist.conf file is ok in default directory. I'm running the brand new version 7.2.4. Can someone help me please?
- Mark as New
- Bookmark Message
- Subscribe to Message
- Mute Message
- Subscribe to RSS Feed
- Permalink
- Report Inappropriate Content
We had the same issue after upgrading to 8.2.4
Cleaning the browser cache solved the issue
- Mark as New
- Bookmark Message
- Subscribe to Message
- Mute Message
- Subscribe to RSS Feed
- Permalink
- Report Inappropriate Content
There seem to be two potential causes for this issue. There are known issues with regards to checklist.conf (currently still open) and for licensing for pre-7.3.6 and pre-8.0.4:
1.) SPL-207786: Monitoring Console Health Check stuck "Loading" if there's an empty checklist.conf stanza defined
I was able to reproduce this issue by creating a checklist.conf file in an app with an empty stanza and restarting splunk.
e.g. some_app/local/checklist.conf
[empty_checklist]
The stanza has no contents. When I renamed/removed that checklist.conf file (or commented out the empty stanza), the Health Check in Monitoring Console loaded fine.
You can search for the stanzas of checklist.conf by running:
$SPLUNK_HOME/bin/splunk btool checklist list --debug
and looking for any empty stanza(s). It's possible to output to a file if it's easier to check that way or to try using grep to simplify the search.
$SPLUNK_HOME/bin/splunk btool checklist list --debug | grep -A 2 "^/.*\[.*\]\s*$"
If any empty stanza(s) are identified, they can be commented out in their respective .conf files. You might run into this issue if you have the Campus Compliance App installed (FYI @Anonymous ) as it has an empty stanza [campus_compliance] in the default folder in checklist.conf.
2.) SPL-183477, SPL-184039, SPL-184962 - MC: Health Check page stuck in "Loading..." when Forwarder license is used
For Splunk 7.x (before 7.3.6) and 8.0.x (before 8.0.4) Instances using the free license - Splunk Enterprise Term Non-Production License, it is recommended to disable the Health Check feature when using the free license. If a UF license is present on the HF or other instances, determine if it's supposed to be there and remove it if possible.
For 7.x, this has been fixed since Splunk 7.3.6+: https://docs.splunk.com/Documentation/Splunk/7.3.6/ReleaseNotes/Fixedissues#Uncategorized_issues
For 8.x, this has been fixed since Splunk 8.0.4+: https://docs.splunk.com/Documentation/Splunk/8.0.4/ReleaseNotes/Fixedissues#Uncategorized_issues
- Mark as New
- Bookmark Message
- Subscribe to Message
- Mute Message
- Subscribe to RSS Feed
- Permalink
- Report Inappropriate Content
$SPLUNK_HOME/bin/splunk btool checklist list --debug | grep -A 2 "^/.*\[.*\]\s*$"
did it for me nicely, removed the file and voila!
thank you very much for given the details and the specific search, I could not find it in the first one
I have been nearly a year without the health check.
- Mark as New
- Bookmark Message
- Subscribe to Message
- Mute Message
- Subscribe to RSS Feed
- Permalink
- Report Inappropriate Content
I had this issue and recently found the solution. I'd suspect you have an empty health check somewhere in a checklist.conf. One way to find this is to load the health check list dashboard (add "_list" to the end of the health check dashboard that doesn't load). Then click on either the name or action field and then disable any empty items there in the UI. The dashboard also shows which app the checks are in so you can look at the checklist.conf in that app to see what's up. In my case I had an app where the attribute settings for a check were all commented out except for the health check name.
- Mark as New
- Bookmark Message
- Subscribe to Message
- Mute Message
- Subscribe to RSS Feed
- Permalink
- Report Inappropriate Content
The problem is most likely that you are clicking on Monitoring Console which is unfortunately always present in the GUI, even though your Search Head is not actually (configured as) a Monitoring Console. Despite how it may appear, it doesn't "just work"; there is some admin-level setup and it MUST NOT be done on a regular Search Head.
- Mark as New
- Bookmark Message
- Subscribe to Message
- Mute Message
- Subscribe to RSS Feed
- Permalink
- Report Inappropriate Content
Did this problem have any known solution?
- Mark as New
- Bookmark Message
- Subscribe to Message
- Mute Message
- Subscribe to RSS Feed
- Permalink
- Report Inappropriate Content
Can you check your browser console (press F12 for most browsers) for errors, so we can exclude client / browser / js problems?
- Mark as New
- Bookmark Message
- Subscribe to Message
- Mute Message
- Subscribe to RSS Feed
- Permalink
- Report Inappropriate Content
Few questions, do you have the admin access and are other components in monitoring console working fine?
- Mark as New
- Bookmark Message
- Subscribe to Message
- Mute Message
- Subscribe to RSS Feed
- Permalink
- Report Inappropriate Content
Yes for both, I have admin access and other MC dashboards are working fine.
- Mark as New
- Bookmark Message
- Subscribe to Message
- Mute Message
- Subscribe to RSS Feed
- Permalink
- Report Inappropriate Content
Did you get a resolution to this?
- Mark as New
- Bookmark Message
- Subscribe to Message
- Mute Message
- Subscribe to RSS Feed
- Permalink
- Report Inappropriate Content
It's likely a permissions issue. Have you tailed the log files while trying to access the health check?
tail -100f $SPLUNK_HOME/var/log/splunk/splunkd.log
An upvote would be appreciated and Accept Solution if it helps!

