Turn on suggestions
Auto-suggest helps you quickly narrow down your search results by suggesting possible matches as you type.
Monitoring Splunk
×
Join the Conversation
Without signing in, you're just watching from the sidelines. Sign in or Register to connect, share, and be part of the Splunk Community.
Turn on suggestions
Auto-suggest helps you quickly narrow down your search results by suggesting possible matches as you type.
- Find Answers
- :
- Splunk Administration
- :
- Monitoring Splunk
- :
- Is it possible to relate the issues displayed in S...
Options
- Subscribe to RSS Feed
- Mark Topic as New
- Mark Topic as Read
- Float this Topic for Current User
- Bookmark Topic
- Subscribe to Topic
- Mute Topic
- Printer Friendly Page
- Mark as New
- Bookmark Message
- Subscribe to Message
- Mute Message
- Subscribe to RSS Feed
- Permalink
- Report Inappropriate Content
Is it possible to relate the issues displayed in Splunk UI to OS data or Splunk logs?
nouraali
Explorer
06-23-2022
05:42 AM
Hello,
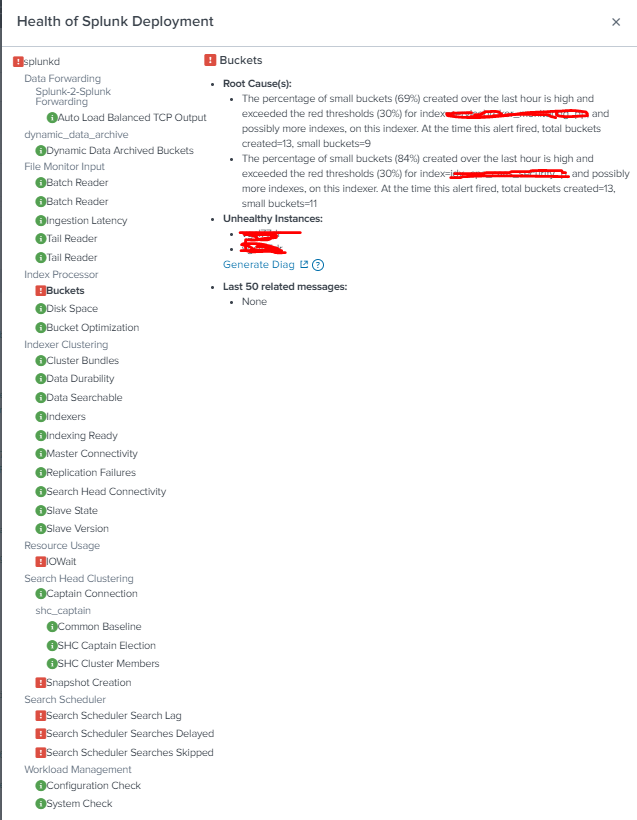
Is it possible to relate the issues displayed in Splunk UI (attached below) to OS data or Splunk logs:
In other words,
Given the OS metrics(RAM,CPU,SWAP,....) of the servers hosting Splunk and Splunk logs, can we relate some trends in this data to below issues:
- The percentage of high priority searches lagged (33%) over the last 24 hours is very high and exceeded the yellow thresholds (10%) on this Splunk instance. Total Searches that were part of this percentage=18. Total lagged Searches=6
- The percentage of small buckets created over the last hour is high and exceeded the red thresholds for index=..., and possibly more indexes, on this indexer. At the time this alert fired, total buckets created=13, small buckets=11
- The percentage of non high priority searches delayed (54%) over the last 24 hours is very high and exceeded the red thresholds (20%) on this Splunk instance. Total Searches that were part of this percentage=574144. Total delayed Searches=314696
- Search peer down
- Disk space/file system under this mount point ... is exceeding the limits 80%
Would really appreciate your response.
Get Updates on the Splunk Community!
Data Management Digest – December 2025
Welcome to the December edition of Data Management Digest!
As we continue our journey of data innovation, the ...
Index This | What is broken 80% of the time by February?
December 2025 Edition
Hayyy Splunk Education Enthusiasts and the Eternally Curious!
We’re back with this ...
Unlock Faster Time-to-Value on Edge and Ingest Processor with New SPL2 Pipeline ...
Hello Splunk Community,
We're thrilled to share an exciting update that will help you manage your data more ...

