Turn on suggestions
Auto-suggest helps you quickly narrow down your search results by suggesting possible matches as you type.
Monitoring Splunk
×
Join the Conversation
Without signing in, you're just watching from the sidelines. Sign in or Register to connect, share, and be part of the Splunk Community.
Turn on suggestions
Auto-suggest helps you quickly narrow down your search results by suggesting possible matches as you type.
- Find Answers
- :
- Splunk Administration
- :
- Monitoring Splunk
- :
- Is it possible to relate the issues displayed in S...
Options
- Subscribe to RSS Feed
- Mark Topic as New
- Mark Topic as Read
- Float this Topic for Current User
- Bookmark Topic
- Subscribe to Topic
- Mute Topic
- Printer Friendly Page
- Mark as New
- Bookmark Message
- Subscribe to Message
- Mute Message
- Subscribe to RSS Feed
- Permalink
- Report Inappropriate Content
Is it possible to relate the issues displayed in Splunk UI to OS data or Splunk logs?
nouraali
Explorer
06-23-2022
05:42 AM
Hello,
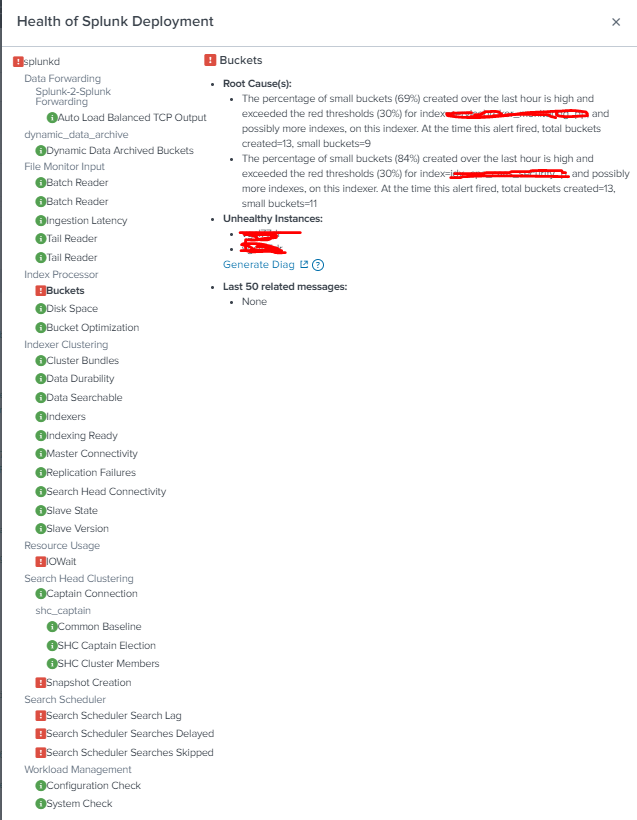
Is it possible to relate the issues displayed in Splunk UI (attached below) to OS data or Splunk logs:
In other words,
Given the OS metrics(RAM,CPU,SWAP,....) of the servers hosting Splunk and Splunk logs, can we relate some trends in this data to below issues:
- The percentage of high priority searches lagged (33%) over the last 24 hours is very high and exceeded the yellow thresholds (10%) on this Splunk instance. Total Searches that were part of this percentage=18. Total lagged Searches=6
- The percentage of small buckets created over the last hour is high and exceeded the red thresholds for index=..., and possibly more indexes, on this indexer. At the time this alert fired, total buckets created=13, small buckets=11
- The percentage of non high priority searches delayed (54%) over the last 24 hours is very high and exceeded the red thresholds (20%) on this Splunk instance. Total Searches that were part of this percentage=574144. Total delayed Searches=314696
- Search peer down
- Disk space/file system under this mount point ... is exceeding the limits 80%
Would really appreciate your response.
Get Updates on the Splunk Community!
Accelerating Observability as Code with the Splunk AI Assistant
We’ve seen in previous posts what Observability as Code (OaC) is and how it’s now essential for managing ...
Integrating Splunk Search API and Quarto to Create Reproducible Investigation ...
Splunk is More Than Just the Web Console
For Digital Forensics and Incident Response (DFIR) practitioners, ...
Congratulations to the 2025-2026 SplunkTrust!
Hello, Splunk Community! We are beyond thrilled to announce our newest group of SplunkTrust members!
The ...

