Turn on suggestions
Auto-suggest helps you quickly narrow down your search results by suggesting possible matches as you type.
Showing results for
Monitoring Splunk
Turn on suggestions
Auto-suggest helps you quickly narrow down your search results by suggesting possible matches as you type.
Showing results for
- Find Answers
- :
- Splunk Administration
- :
- Monitoring Splunk
- :
- In Monitoring console where I can find this dashbo...
Options
- Subscribe to RSS Feed
- Mark Topic as New
- Mark Topic as Read
- Float this Topic for Current User
- Bookmark Topic
- Subscribe to Topic
- Mute Topic
- Printer Friendly Page
- Mark as New
- Bookmark Message
- Subscribe to Message
- Mute Message
- Subscribe to RSS Feed
- Permalink
- Report Inappropriate Content
Praz_123
Path Finder
03-05-2024
10:24 PM
Can , anyone help me where can I find the above dashboard in splunk , in Monitoring console.
1 Solution
- Mark as New
- Bookmark Message
- Subscribe to Message
- Mute Message
- Subscribe to RSS Feed
- Permalink
- Report Inappropriate Content
kiran_panchavat
Builder
03-05-2024
10:45 PM
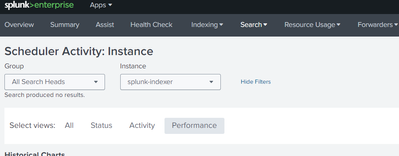
@Praz_123 I can see "Execution Latency Over Time" panel in the "Search > Scheduler Activity:Instance" > Performance in the Splunk Version:9.2.0.1
- Mark as New
- Bookmark Message
- Subscribe to Message
- Mute Message
- Subscribe to RSS Feed
- Permalink
- Report Inappropriate Content
Praz_123
Path Finder
03-05-2024
11:50 PM
@kiran_panchavat , thanks for your help
- Mark as New
- Bookmark Message
- Subscribe to Message
- Mute Message
- Subscribe to RSS Feed
- Permalink
- Report Inappropriate Content
kiran_panchavat
Builder
03-05-2024
10:45 PM
@Praz_123 I can see "Execution Latency Over Time" panel in the "Search > Scheduler Activity:Instance" > Performance in the Splunk Version:9.2.0.1
Get Updates on the Splunk Community!
Enterprise Security Content Update (ESCU) | New Releases
In December, the Splunk Threat Research Team had 1 release of new security content via the Enterprise Security ...
Why am I not seeing the finding in Splunk Enterprise Security Analyst Queue?
(This is the first of a series of 2 blogs).
Splunk Enterprise Security is a fantastic tool that offers robust ...
Index This | What are the 12 Days of Splunk-mas?
December 2024 Edition
Hayyy Splunk Education Enthusiasts and the Eternally Curious!
We’re back with another ...


